Cost Plan Analysis
Overview of Cost Plan Analysis
You can analyze product costs using detailed planned cost structures, cost of goods manufactured, and contribution margin of products in the following worksheets:
Setting Up Cost Data Creation for Analysis
After you set up allocation pools, scopes, drivers, rules, and cost plans—run the following background processes to generate data for displaying on the Smart View worksheets and Oracle Analytics Cloud Service dashboards. Submit these processes in the following order:
-
Import Supply/Demand for Cost Planning and Validate Cost Planning Scopes
-
Import Supply/Demand for Cost Planning imports the supply and demand that a cost plan uses to calculate driver values and unit costs. Load the supply/demand plans into the REST web service Supply/Demand interface before running this program.
-
Validate Cost Planning Scopes validates the allocation scopes and finds any invalid settings.
Note: You can run these programs in any order, but both must be generated before running the In-Memory Cost Planning Engine, which requires the results of these programs to create data.
-
-
In-Memory Cost Planning Engine executes the cost plans and performs the driver value calculation, allocated amount calculation, and unit cost calculation for each plan month.
-
Margin Load for Cost Plans performs the margin load and calculates the profitability impact using the plan costs.
-
Calculate Actual COGM calculates the actual cost of goods manufactured for a given cost plan. The actual COGM can be used to compare with the plan COGM.
Note: To ensure accurate data, run this program after the plan months have passed, when the actual cost data is available.
Related Topics
Overview of In-Memory Cost Management Cloud Service REST Web Services
Viewing Plan Organization Summary Cost Information
The Plan Organization Summary worksheet enables you to analyze the Cost of Goods Manufactured (COGM) and the contribution margin for all organizations, providing a view of cost saving areas when compared across the organization.
To view plan organization summary information for Discrete products
-
Navigate to the Plan Organization Summary worksheet for a specific Plan Code and Production Plan.
The following information appears for the Plan Code and Production Plan value combination in the worksheet heading:
-
Description
-
From and To Month date range
-
Category Set
-
Margin From and To Month date range
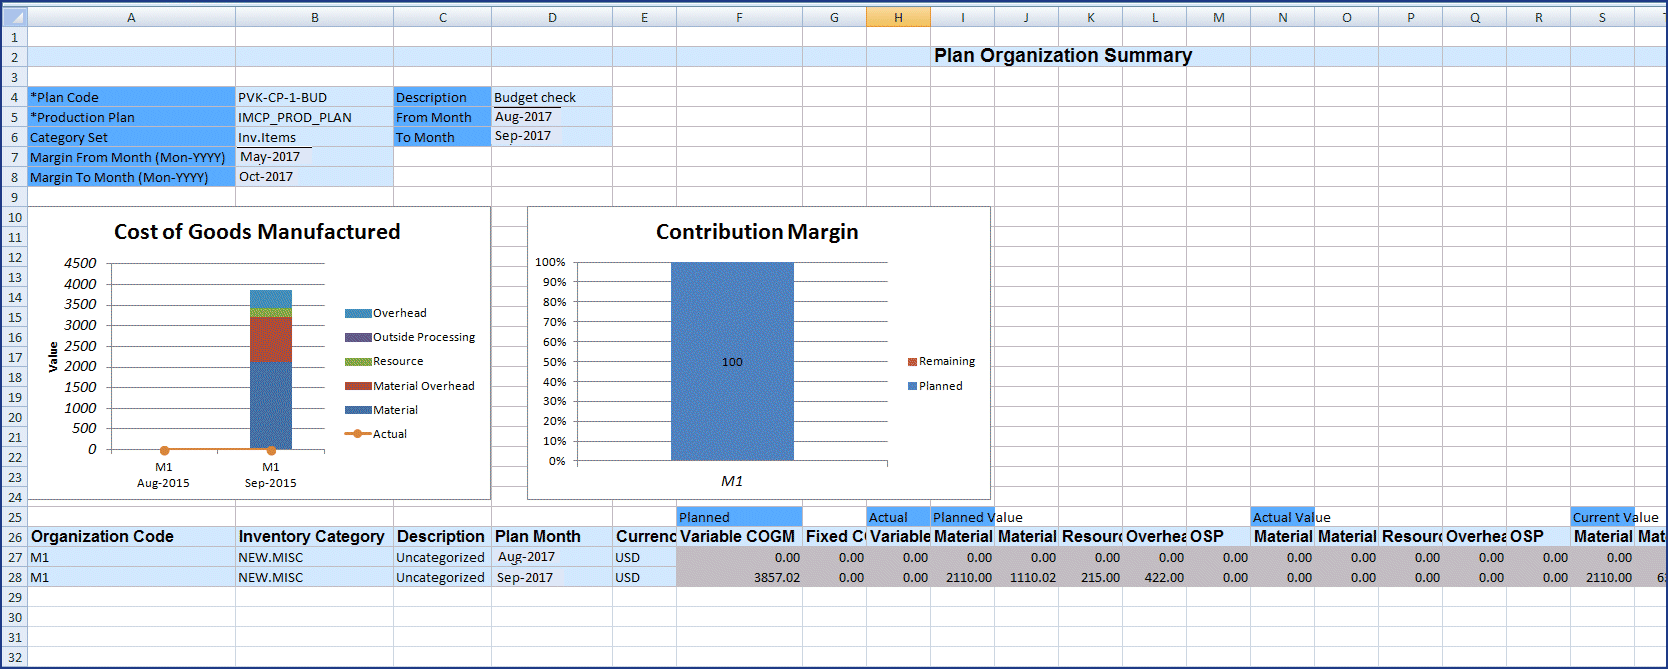
The graphs display the following data:
-
The Cost of Goods Manufactured shows the costs per month for the organization.
-
The Contribution Margin shows the percentage of cost contribution per unit, representing the portion of sales revenue that contributes to the coverage of fixed costs.
In the section following the graphs, details for each organization and for the plan month display planned and actual costs in the following rows:
-
Organization Code
-
Inventory Category
-
Description
-
Plan Month
-
Currency: The primary currency associated with the general ledger
-
Planned Variable COGM: Cost plan total cost multiplied by planned production volume.
-
Planned Fixed COGM: Cost plan total fixed cost.
-
Actual Variable COGM: Actual costs incurred to produce the item.
-
Planned Value–For Material, Material Overhead, Resource, Overhead, Outside Processing:
planned cost multiplied by planned production
-
Actual Value–For Material, Material Overhead, Resource, Overhead, Outside Processing:
actual cost incurred in production
-
Current Value–For Material, Material Overhead, Resource, Overhead, Outside Processing:
current cost multiplied by planned production
-
-
Select an organization and double-click to navigate to the Item Summary worksheet. See: Viewing Plan Item Summaries and Details
-
Select Launch Gross Profit Analyzer to display the dashboard. See: Overview of Analyzing Gross Profits
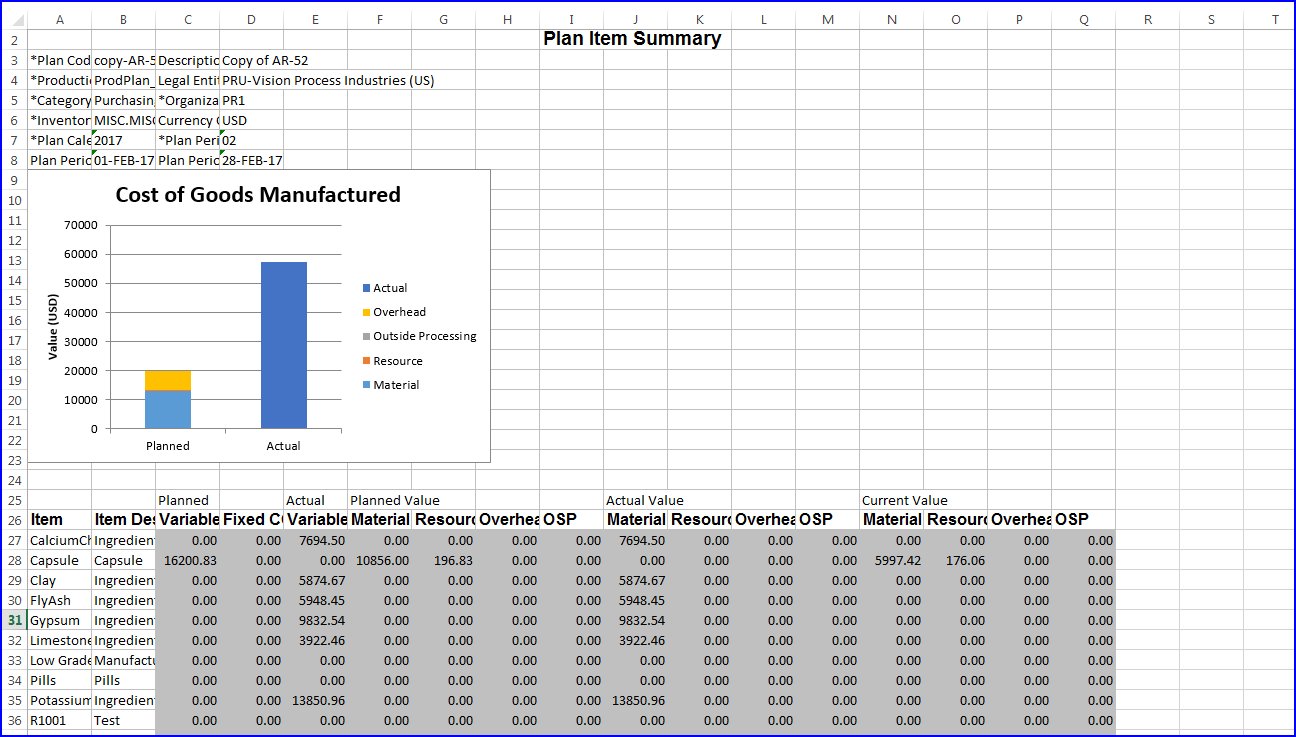
To view plan organization summary information for Process products
-
Navigate to the Plan Organization Summary worksheet for a specific Plan Code and Production Plan.
The following information appears for the Plan Code and Production Plan value combination in the worksheet heading:
-
Description
-
Legal Entity
-
From and To Margin date range
-
Category Set
-
Margin From and To Period date range
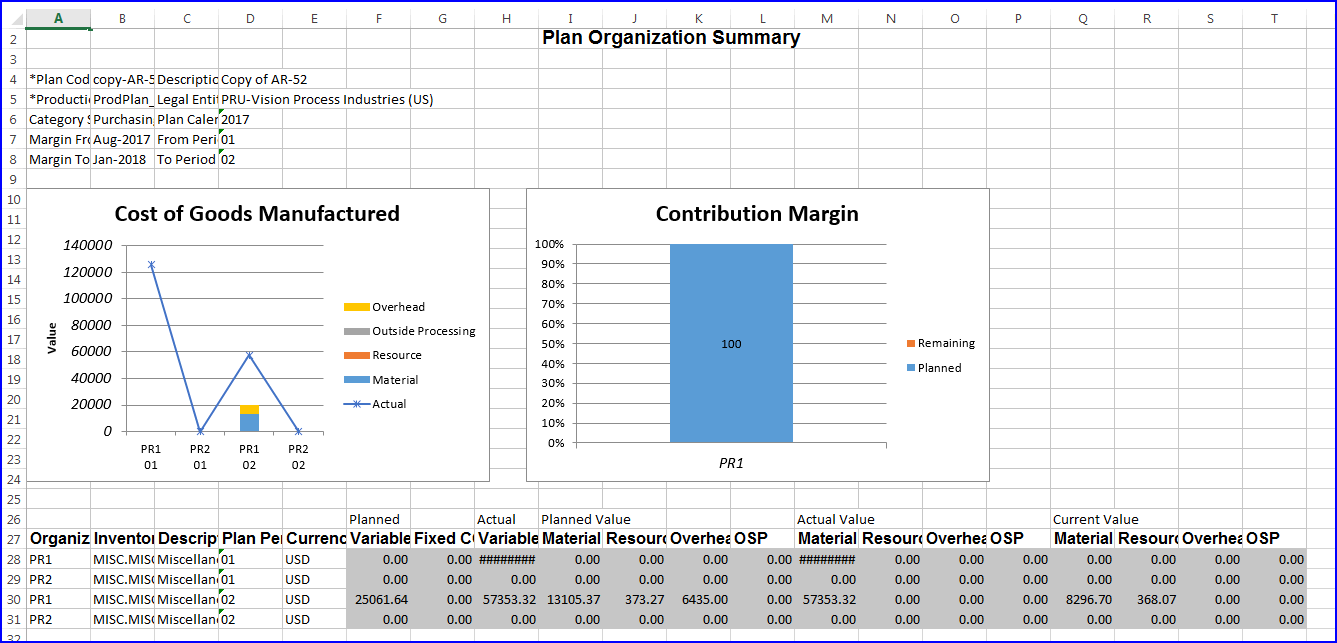
The graphs display the following data:
-
The Cost of Goods Manufactured shows the costs per month for the organization.
-
The Contribution Margin shows the percentage of cost contribution per unit, representing the portion of sales revenue that contributes to the coverage of fixed costs.
In the section following the graphs, details for each organization and for the plan month display planned and actual costs in the following rows:
-
Organization Code
-
Inventory Category
-
Description
-
Plan Period
-
Currency: The primary currency associated with the general ledger
-
Planned Variable COGM: Cost plan total cost multiplied by planned production volume.
-
Planned Fixed COGM: Cost plan total fixed cost.
-
Actual Variable COGM: Actual costs incurred to produce the item.
-
Planned Value–For Material, Material Overhead, Resource, Overhead, Outside Processing:
planned cost multiplied by planned production
-
Actual Value–For Material, Material Overhead, Resource, Overhead, Outside Processing:
actual cost incurred in production
-
Current Value–For Material, Material Overhead, Resource, Overhead, Outside Processing:
current cost multiplied by planned production
-
-
Select an organization and double-click to navigate to the Item Summary worksheet. See: Viewing Plan Item Summaries and Details
-
You can select the following functions in the In-Memory Cost Management ribbon:
-
Calculate Gross Profit to run a required background process for viewing the Gross Profit Analyzer dashboard, see: Background Processes
-
Launch Gross Profit Analyzer to display the dashboard after running the required background process and view the impact of the simulation just created on COGS and margins, see: Viewing an Overview of Gross Profits
-
Viewing Plan Item Summaries and Details
You can navigate to the Organization Summary worksheet and Zoom In to a single item's cost summary. This enables you to review details for each item in a plan month or period for planned, actual and current costs. The Cost of Manufactured Goods chart shows the value for planned and actual costs.
To view plan item summary information for Discrete products
-
Navigate to the Plan Item Summary worksheet for a particular item.
The following information appears in the worksheet heading:
-
Plan Code
-
Description
-
Production Plan
-
Plan Month
-
Category Set
-
Organization Code
-
Inventory Category
-
Currency Code
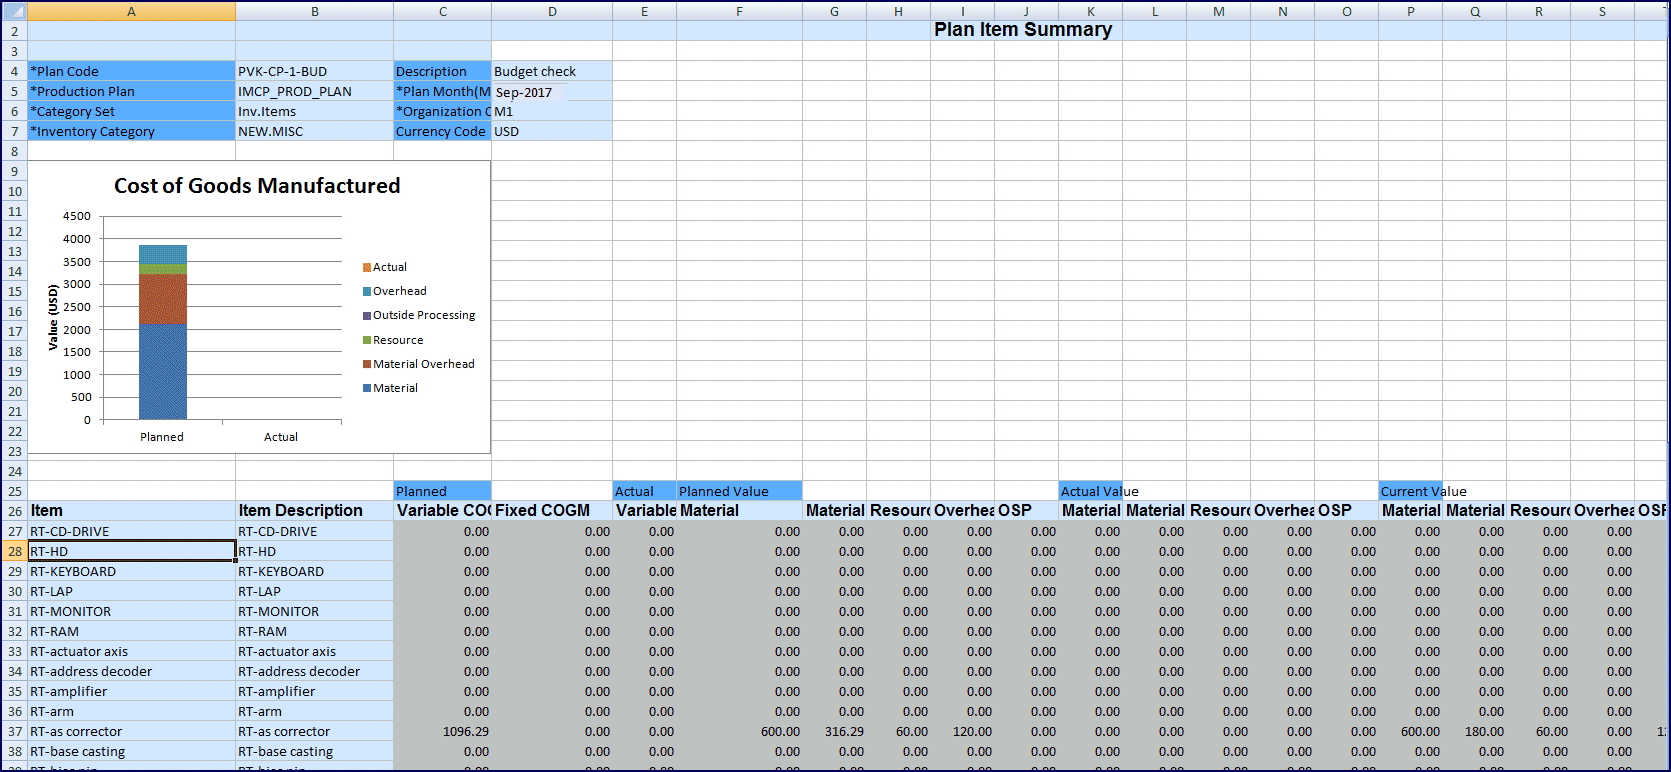
In the Item listing, you can review the following data for each Item record:
-
Planned Variable COGM: total cost multiplied by planned production volume
-
Planned Fixed COGM: total fixed cost
-
Actual Variable COGM: cost incurred to produce the item in production
The calculation comes from work orders, material, and resources charged for the time period.
-
Planned Value–For Material, Material Overhead, Resource, Overhead, Outside Processing:
planned cost multiplied by planned production
-
Actual Value–For Material, Material Overhead, Resource, Overhead, Outside Processing:
actual cost incurred in production
-
Current Value–For Material, Material Overhead, Resource, Overhead, Outside Processing:
current cost multiplied by planned production
-
-
You can select the following functions in the In-Memory Cost Management ribbon:
-
Calculate Gross Profit to run a required background process for viewing the Gross Profit Analyzer dashboard, see: Background Processes
-
Launch Gross Profit Analyzer to display the dashboard after running the required background process and view the impact of the simulation just created on COGS and margins, see: Viewing an Overview of Gross Profits
-
-
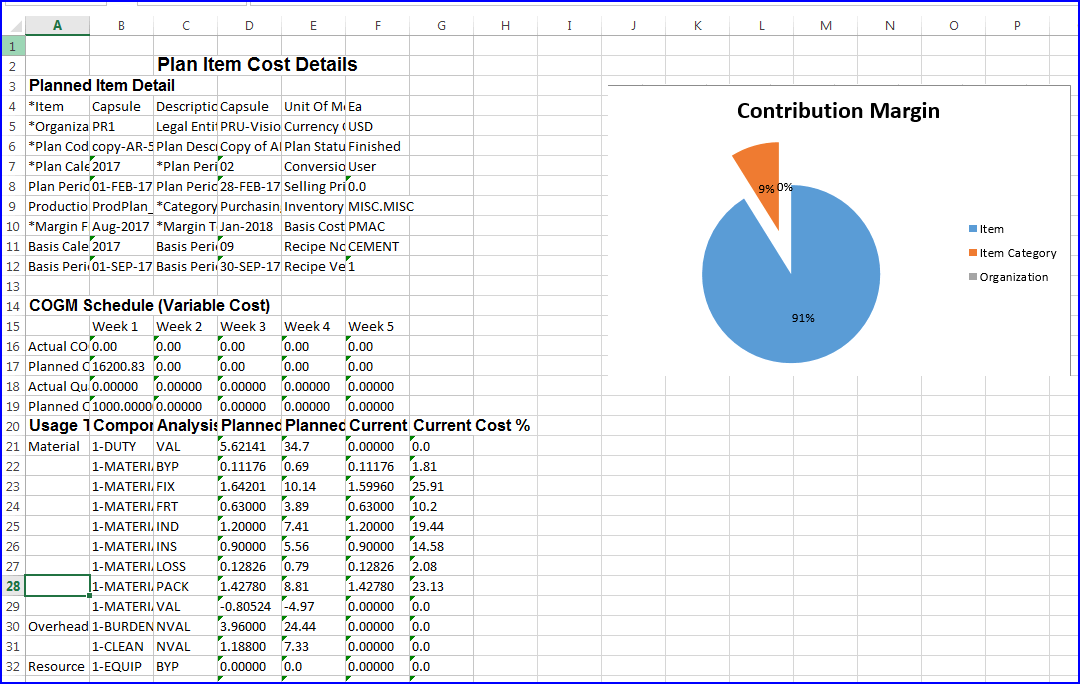
Select an item and the Zoom In tool (or double-click left mouse button) to the Plan Item Cost Details worksheet.
This worksheet is divided into three regions for a specific item:
-
Planned Item Detail
Provides the details of the cost plan in the following fields: Item, Description, Item Type, Organization Code, Currency Code, Revision, Plan Code, Plan Description, Item Status, Plan Month, Plan Status, Alternate Bills, Margin From and To Months, Effective Date, Engineering Bills, Inventory Category, Unimplemented ECO, Category Set, Basis Cost Type, Alternate Routing, Production Plan, Conversion Type, Assignment Set, Standard Lot Size, Lifecycle Phase, Selling Price, Unit of Measure, and Lifecycle.
-
COGM Schedule
Shows the weekly Actual and Planned Cost of Goods Manufactured and quantities.
-
Cost Element
Provides a view of the detailed cost structure of the product for both planned and current costs. The columns in this region are: Cost Element, Subelement, Planned Cost, Planned Cost Percentage, Current Cost, and Current Cost Percentage.
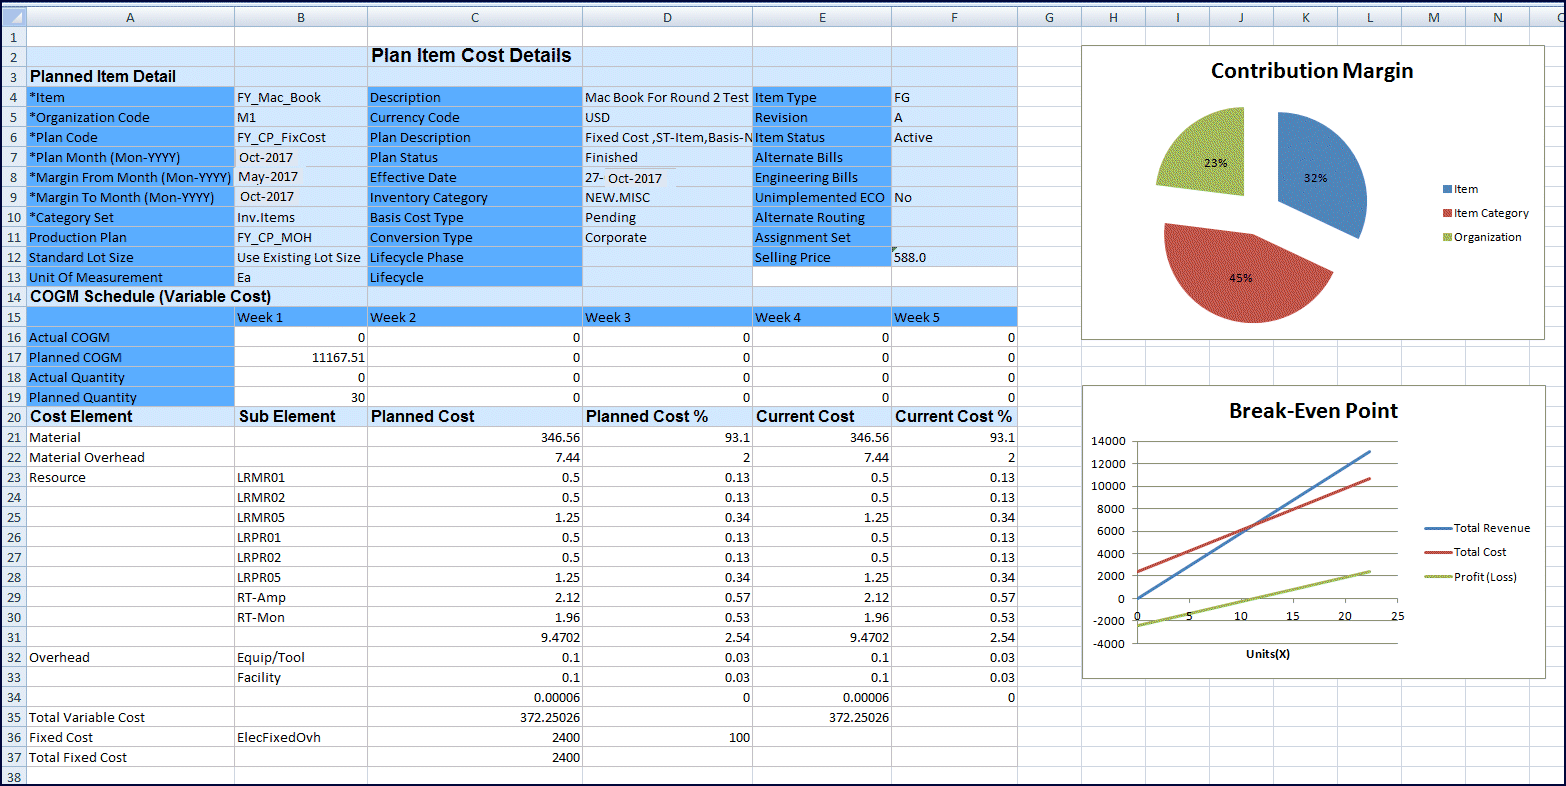
The Contribution Margin graph shows the fixed COGM allocated to the product which is used for analyzing this product in relationship to the organization and category of items.
The Break-Even Point graph is used to analyze the production point of balance between making either a profit or a loss. The break-even point is achieved when the generated profits match the total costs accumulated. This graph appears when you are viewing a plan using fixed costs.
-
-
Select the item and use the Zoom In tool (or double-click left mouse button) to access the Plan Cost Structure Details worksheet. See: Viewing Item Plan Cost Structure Details
-
You can select the following functions in the In-Memory Cost Management ribbon:
-
Calculate Gross Profit to run a required background process for viewing the Gross Profit Analyzer dashboard, see: Background Processes
-
Launch Gross Profit Analyzer to display the dashboard after running the required background process and view the impact of the simulation just created on COGS and margins, see: Viewing an Overview of Gross Profits
-
To view plan item summary information for Process products
-
Navigate to the Plan Item Summary worksheet for a particular item.
The following information appears in the worksheet heading:
-
Plan Code
-
Description
-
Production Plan
-
Legal Entity
-
Category Set
-
Organization Code
-
Inventory Category
-
Currency Code
-
Plan Calendar
-
Plan Period
-
Plan Period Start and End Date
In the Item listing, you can review the following information for each Item record:
-
Planned Variable COGM: total cost multiplied by planned production volume
-
Planned Fixed COGM: total fixed cost
-
Actual Variable COGM: cost incurred to produce the item in production
The calculation comes from work orders, material, and resources charged for the time period.
-
Planned Value–For Material, Material Overhead, Resource, Overhead, Outside Processing:
planned cost multiplied by planned production
-
Actual Value–For Material, Material Overhead, Resource, Overhead, Outside Processing:
actual cost incurred in production
-
Current Value–For Material, Material Overhead, Resource, Overhead, Outside Processing:
current cost multiplied by planned production
-
-
You can select the following functions in the In-Memory Cost Management ribbon:
-
Calculate Gross Profit to run a required background process for viewing the Gross Profit Analyzer dashboard, see: Background Processes
-
Launch Gross Profit Analyzer to display the dashboard after running the required background process and view the impact of the simulation just created on COGS and margins, see: Viewing an Overview of Gross Profits
-
-
Select an item and the Zoom In tool (or double-click left mouse button) to the Plan Item Cost Details worksheet.
This worksheet is divided into three regions for a specific item:
-
Planned Item Detail
Provides the details of the cost plan in the following fields: Item, Description, Unit of Measure, Organization Code, Legal Entity, Currency, Plan Code, Plan Description, Plan Status, Plan Calendar, Plan Period, Selling Price, Production Plan, Category, Inventory Category, Margin From and To Month, Basis Cost, Basis Calendar, Basis Period, Recipe Number, Basis Start and End Date, Recipe Version.
-
COGM Schedule
Shows the weekly Actual and Planned Cost of Goods Manufactured and quantities.
-
Usage Type
Provides a view of the detailed cost structure of the product for both planned and current costs. The columns in this region are: Usage Type, Component Class Code, Analysis Code, Planned Cost, Planned Cost Percentage, Current Cost, and Current Cost Percentage.
The Contribution Margin graph shows the fixed COGM allocated to the product which is used for analyzing this product in relationship to the organization and category of items.
The Break-Even Point graph is used to analyze the production point of balance between making either a profit or a loss. The break-even point is achieved when the generated profits match the total costs accumulated. This graph appears when you are viewing a plan using fixed costs.
-
-
Select the item and use the Zoom In tool (or double-click left mouse button) to access the Plan Cost Structure Details worksheet. See: Viewing Item Plan Cost Structure Details
-
Select Launch Gross Profit Analyzer to display the dashboard. See:
-
You can select the following functions in the In-Memory Cost Management ribbon:
-
Calculate Gross Profit to run a required background process for viewing the Gross Profit Analyzer dashboard, see: Background Processes
-
Launch Gross Profit Analyzer to display the dashboard after running the required background process and view the impact of the simulation just created on COGS and margins, see: Viewing an Overview of Gross Profits
-
Viewing Plan Item Cost Structure Details
You can query a cost plan and review the details including the bill of materials and routing, and resources or rates, or recipes and steps, and resources or rates.
To view plan cost structure details for Discrete products
-
Navigate to the Plan Cost Structure Details worksheet.
The header section of the worksheet displays the manufacturing details of the cost plan in the following fields: Plan Code, Plan Description, Plan Month, Assignment Set, Item, Basis Alternate Routing, Organization Code, Plan Cost, Conversion Type, Basis Alternate Bill of Material, Basis Cost Type, Effectivity Date, Buy Cost Type, Lot Size Option, Engineering Bills, Lot Size Setting, Unimplemented ECO, and Status.
The Total Extended Cost for the assembly in the cost structure details appears for these manufacturing options.
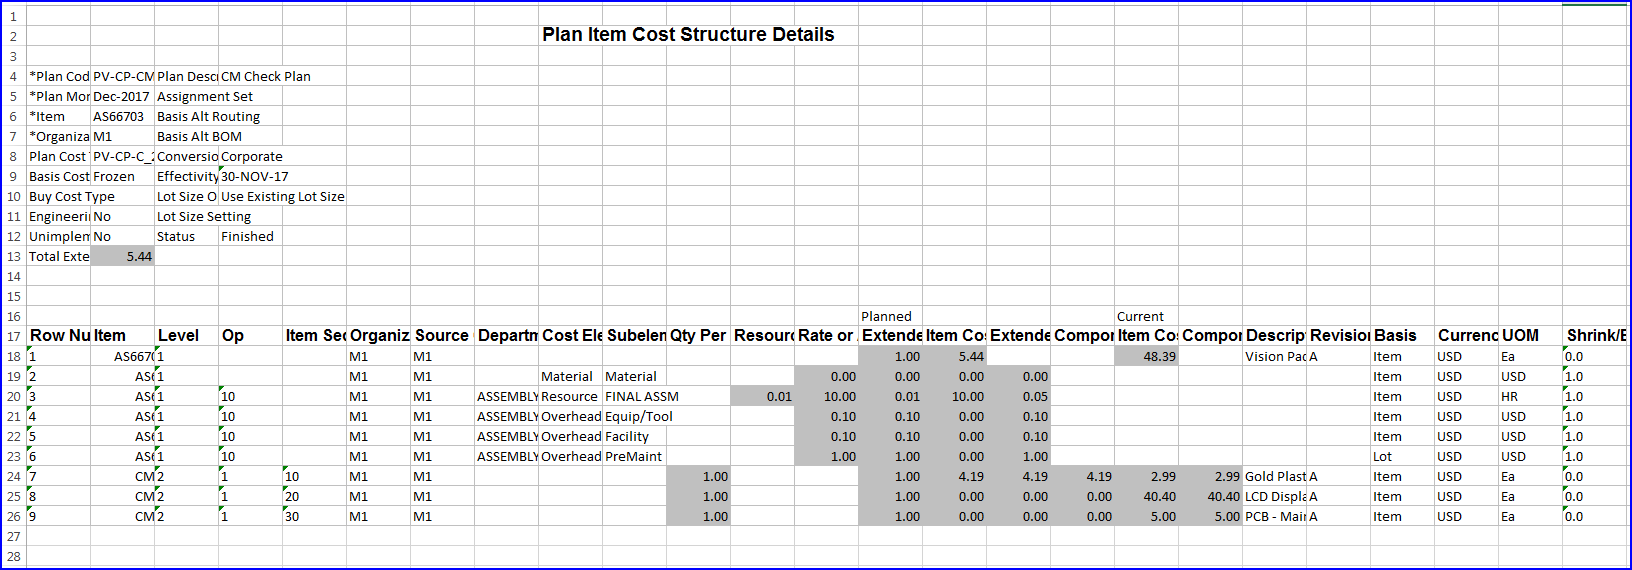
You can review the entire bill of material and routing of this product, including all details of the costs. This data shows in the following fields:
-
Item, Level, Operation, Item Sequence, Organization, Source, Department, Cost Element, Cost Subelement, Quantity Per Assembly, Resource Usage Rate Per Assembly, and Rate or Amount
-
Planned: Extended Quantity Rate or Amount, Item Cost Resource Rate, Extended Cost, and Component Extended Cost
-
Current: Item Cost, Component Extended Cost
-
Description, Revision, Basis, Currency Code, Unit of Measure, Shrink/Basis Factor, Phantom, Make or Buy, Included in Rollup, Based on Rollup, Inventory Asset Costed, Item Type, Item Status, Lifecycle, Lifecycle Phase, and Extended Cost Flag
-
-
You can select the following functions in the In-Memory Cost Management ribbon:
-
When a cost plan is setup, the Launch Simulation icon in the ribbon is enabled. Select Launch Simulation to navigate to the Create Simulation worksheet, see: Creating Cost Simulations
-
Calculate Gross Profit to run a required background process for viewing the Gross Profit Analyzer dashboard, see: Background Processes
-
Launch Gross Profit Analyzer to display the dashboard after running the required background process and view the impact of the simulation just created on COGS and margins, see: Viewing an Overview of Gross Profits
-
To view plan cost structure details for Process products
-
Navigate to the Plan Cost Structure Details worksheet.
The header section of the worksheet displays the manufacturing details of the cost plan in the following fields: Plan Code, Plan Description, Plan Status, Plan Calendar, Plan Period, Legal Entity, Conversion Type, Item, Organization Code, Unit of Measure, Basis Calendar, Basis Period, Basis Cost Type, Basis Period Start and End Dates, Total Extended Cost, Recipe Number, and Recipe Version.
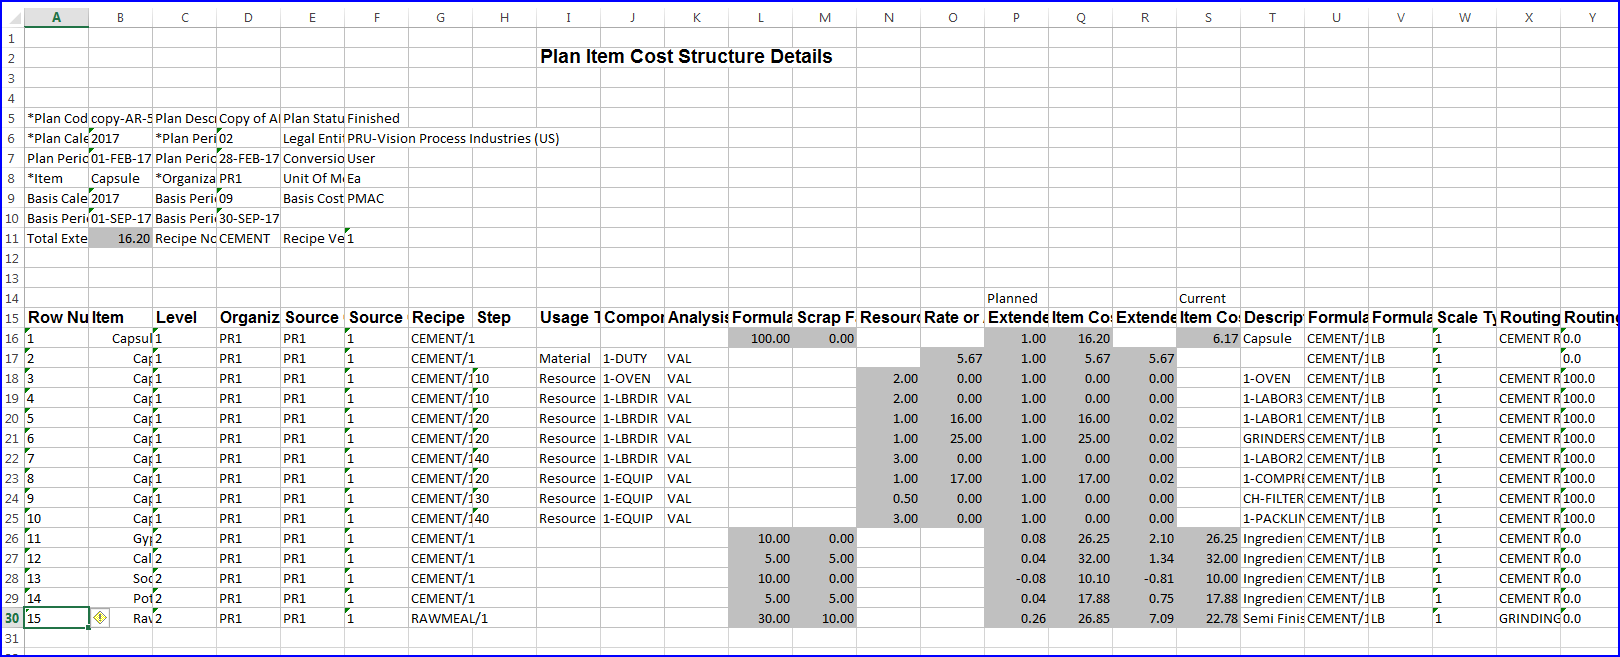
You can review the recipes, steps, and resources or rates for this product—including all details of the costs. This data shows in the following fields: Item, Level, Organization, Source Organization, Source Organization Percent, Recipe, Step, Usage Type, Component Class Code, Analysis Code, Formula Quantity, Scrap Factor, Resource Usage, Rate or Amount, Planned Extended Quantity or Rate or Amount, Planned Item Cost or Resource Rate, Planned Extended Cost Current Item Cost, Description, Formula, Formula Quantity or /Resource Usage Unit of Measure, Scale Type, Routing, Routing or Burden Item Quantity, Routing Unit of Measure, Operation, Step Quantity, Step Quantity Unit of Measure, Process Quantity, Process Quantity Unit of Measure, Resource Count, Activity Factor, Currency Code, and Included in Rollup.
-
You can select the following functions in the In-Memory Cost Management ribbon:
-
When a cost plan is setup, the Launch Simulation icon in the ribbon is enabled. Select Launch Simulation to navigate to the Create Simulation worksheet, see: Creating Cost Simulations
-
Calculate Gross Profit to run a required background process for viewing the Gross Profit Analyzer dashboard, see: Background Processes
-
Launch Gross Profit Analyzer to display the dashboard after running the required background process and view the impact of the simulation just created on COGS and margins, see: Viewing an Overview of Gross Profits
-
Viewing Overhead Summaries and Details
You can model overhead and review granular views on the costs, and see what portion of the overhead is attributed to a particular cost center. Overheads are captured and maintained as part of various expense management and budgetary control systems–and recorded as a general ledger expense. Overhead is incurred at various levels of organization (corporate, facility, batch, item). You can identify overheads based on Organization, Cost Type, Overhead, WIP Accounting Class, and Department.
-
General overhead costs (manufacturing facility rent, energy, and salaries) are usually estimated based on an analysis of prior period expenses.
-
The projected fiscal period cost of each overhead is allocated to individual products by calculating an overhead burden rate for each product, adding this rate to the product's standard cost structure.
Note: This worksheet only applies to Discrete products.
To view overhead summaries
-
Navigate to the Plan Overhead Summary worksheet.
Summary information on the overhead costs appears in the Plan Detail section in the following fields: Plan Code, Plan Description, Alternate Bills, Alternate Routing, Engineering Bills, Unimplemented ECO, Assignment Set, and Basis Cost Type.
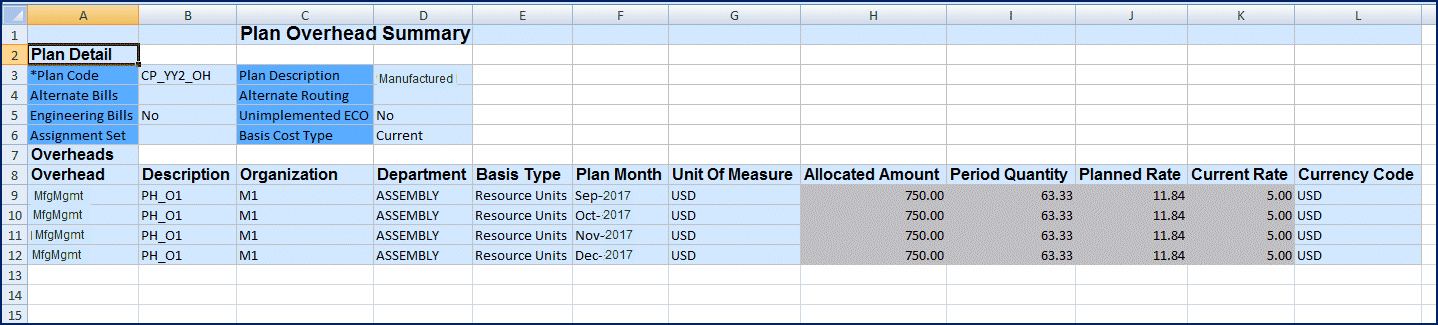
In the Overheads region of the worksheet, the summary information on individual overheads appears in the following fields: Overhead, Description, Organization, Department, Basis Type, Plan Month, Unit of Measure, Allocated Amount, Period Quantity, Planned Rate, Current Rate, Currency Code.
-
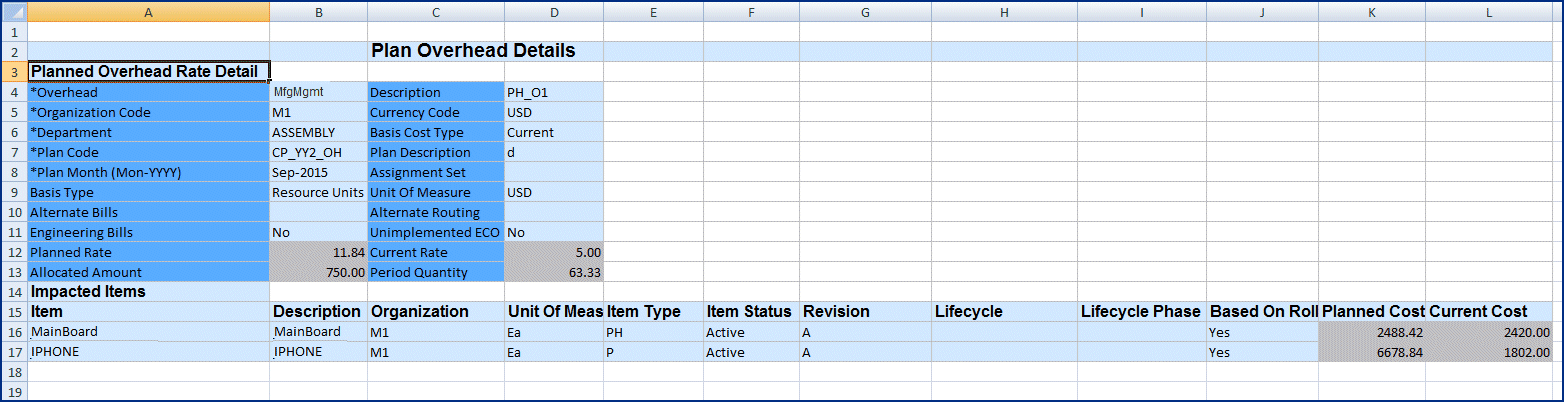
Select an overhead record and Zoom In to navigate to the Plan Overhead Details worksheet.
This worksheet is divided into two sections:
-
Planned Overhead Rate Detail section contains information in the following fields: Overhead, Description, Organization Code, Currency Code, Department, Basis Cost Type, Plan Code, Plan Description, Plan Month, Assignment Set, Basis Type, Unit of Measure, Alternate Bills, Alternate Routing, Engineering Bills, Unimplemented ECO, Planned Rate, Current Rate Allocated Amount, and Period Quantity.
-
Impacted Items section shows the items impacted by the overhead in the following fields: Item, Description, Organization, Item Type, Item Status, Revision, Lifecycle, Lifecycle Phase, and Based on Rollup.
The extended Planned Cost and Current Cost appear for each item on the worksheet.
-
Viewing Resource Summaries and Details
Cost Planning provides features to consolidate all the related resource rates. You can model resources and review granular views on the costs, and see what portion of the resources are attributed to a particular cost center. Resources are incurred at various levels
To view plan resource summary information for the Discrete application
-
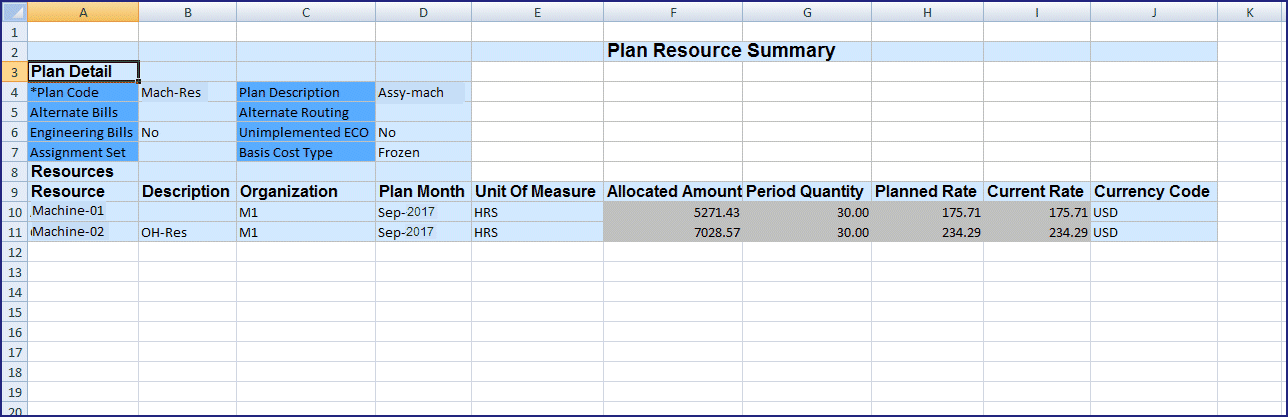
Navigate to the Plan Resource Summary worksheet.
The worksheet is divided into two sections:
-
Plan Detail section contains information in the following fields: Plan Code, Plan Description, Alternate Bills, Alternate Routing, Engineering Bills, Unimplemented ECO, Assignment Set, and Basis Cost Type.
-
Resources section is a listing of the resources for this plan code and shows information in the following fields: Resource, Description, Organization, Plan Month, Unit of Measure, Allocated Amount, Period Quantity, Planned Rate, Current Rate, and Currency Code.
-
-
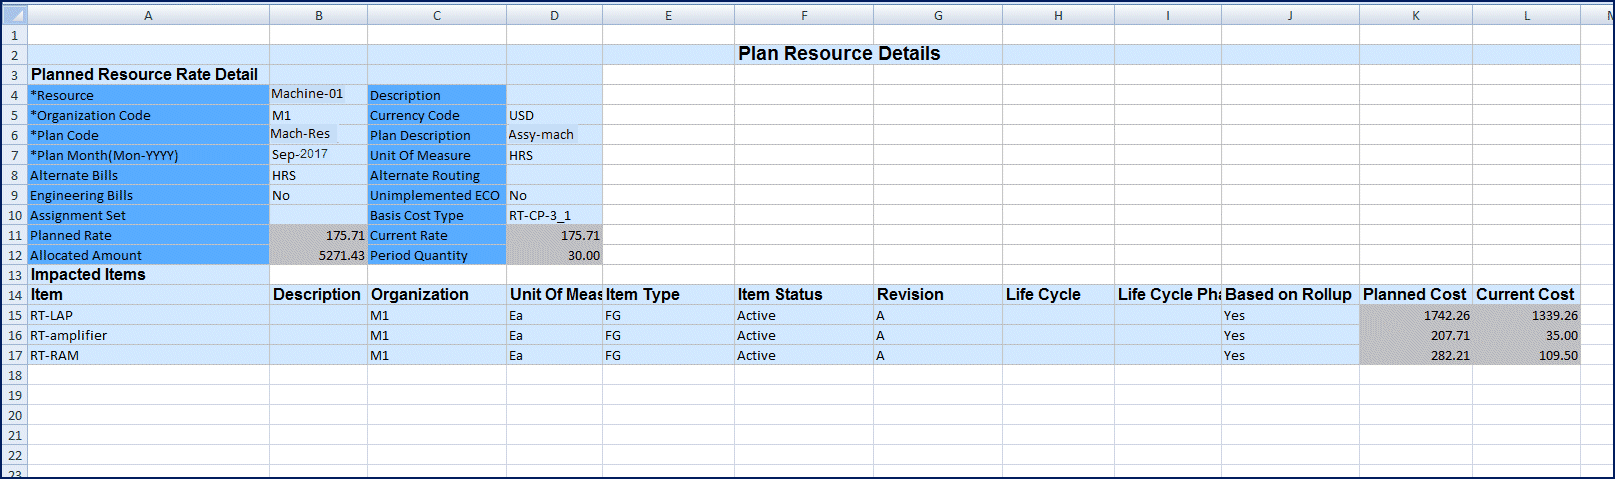
Select a resource record and Zoom In (or double-click left mouse button) to navigate to the Plan Resource Details worksheet.
This worksheet is divided into two sections:
-
Planned Resource Rate Detail section contains information in the following fields: Resource, Description, Organization Code, Currency Code, Plan Code, Plan Description, Plan Month, Unit of Measure, Alternate Bills, Alternate Routing, Engineering Bills, Unimplemented ECO, Assignment Set, Basis Cost Type, Planned Rate, Current Rate Allocated Amount, and Period Quantity.
-
Impacted Items section shows the items impacted by the resource in the following fields: Item, Description, Organization, Item Type, Item Status, Revision, Lifecycle, Lifecycle Phase, and Based on Rollup.
The extended Planned Cost and Current Cost appears for each item on the worksheet.
-
-
Select an item and Zoom In (or double-click left mouse button) to access the Plan Item Cost Details worksheet. see: Plan Item Summary and Details
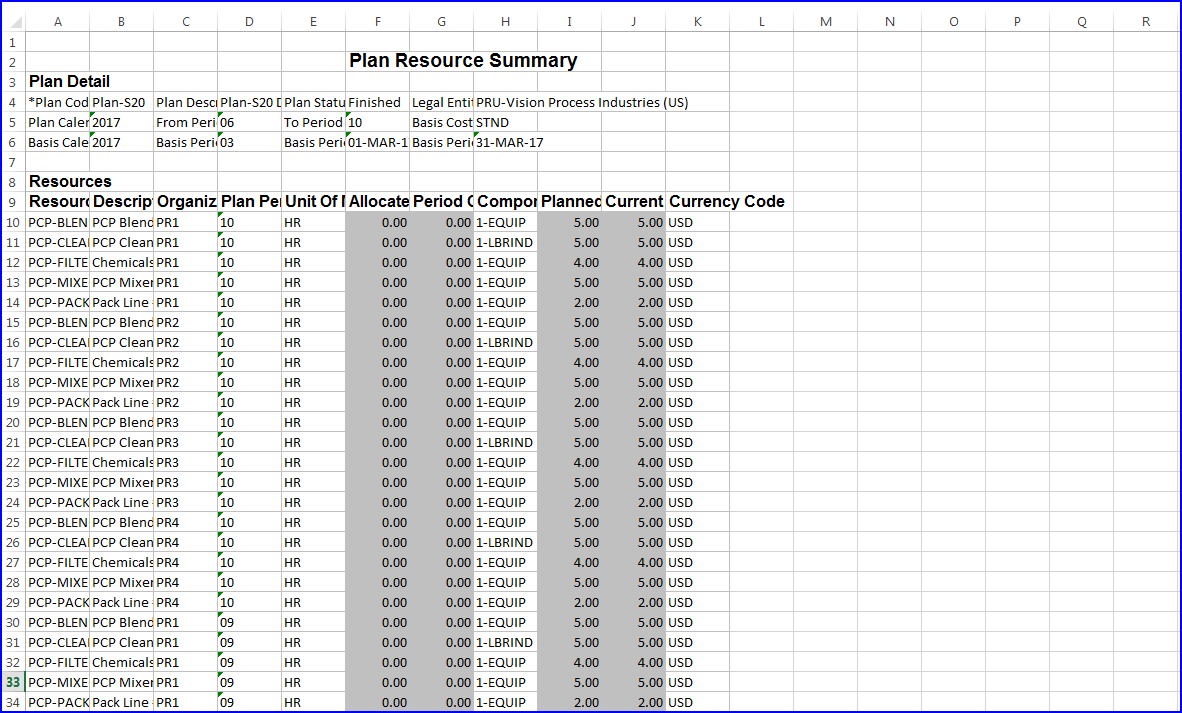
To view plan resource summary information for the Process application
-
Navigate to the Plan Resource Summary worksheet choosing the Process application
The worksheet is divided into two sections:
-
Plan Detail section contains information in the following fields: Plan Code, Plan Description, Plan Status, Legal Entity, Plan Calendar, From and To Period, Basis Cost Type, Basis Calendar, Basis Period, and Period Start and End Date.
-
Resources section is a listing of the resources for this plan code and shows information in the following fields: Resource, Description, Organization, Plan Period, Unit of Measure, Allocated Amount, Period Quantity, Component Class Code, Planned Rate, Current Rate, and Currency Code.
-
-
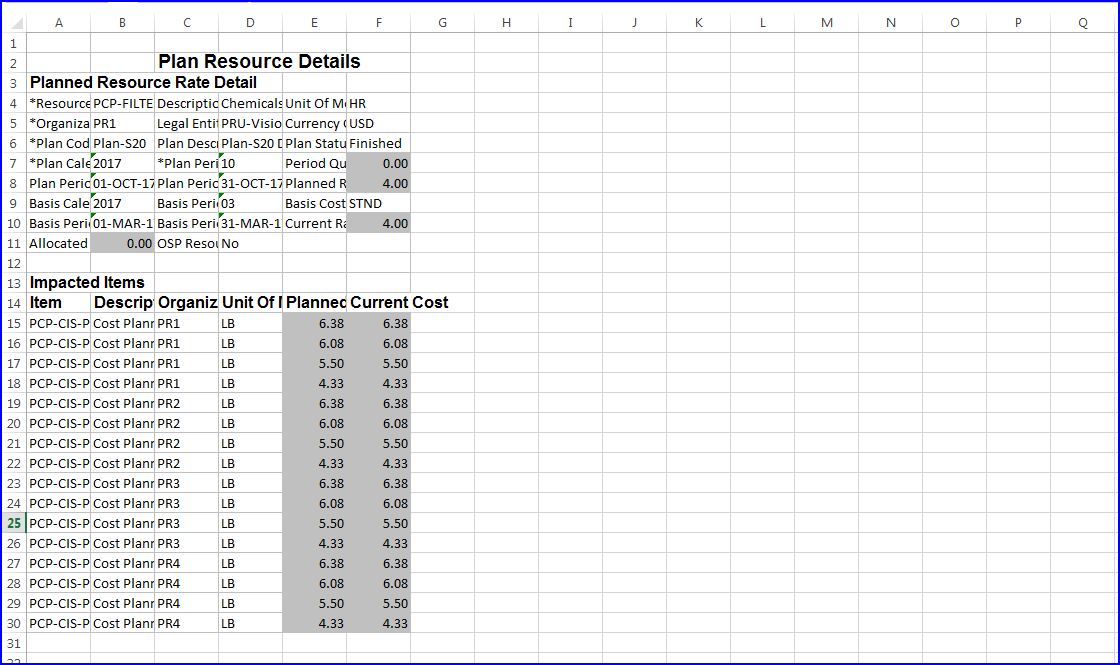
Select a resource record and Zoom In (or double-click left mouse button) to navigate to the Plan Resource Details worksheet.
This worksheet is divided into two sections:
-
Planned Resource Rate Detail section contains information in the following fields: Resource, Description, Organization, Unit of Measure, Legal Entity, Currency Code, Plan code, Plan Description, Plan Status, Plan Calendar, Plan Period, Period Quantity, Plan Period Start and End Date, Planned Rate, Basis Calendar, Basis Period, Basis Cost Type, Basis Period Start and End Date, Current Rate, Allocated Amount, and Outside Processing Resource.
-
Impacted Items section shows the items impacted by the resource in the following fields: Item, Description, Organization, and Unit of Measure.
The extended Planned Cost and Current Cost appears for each item on the worksheet.
-
-
Select an item and Zoom In (or double-click left mouse button) to access the Plan Item Cost Details worksheet. see: Plan Item Summary and Details