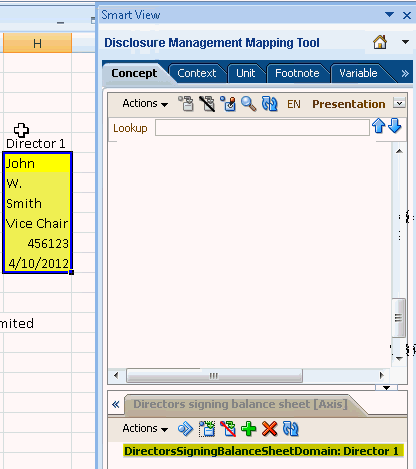
About Dimensions
A dimension is a slice of a default domain of an axis of a hypercube. In taxonomies, a dimension member is part of a group of other dimension members, which contain a default dimension or default domain. A hypercube is also known as a "Table". For example: Dimension members exist under a default dimension such as: Toys [Default dimension], Dolls [dimension member], Bats [dimension member], and Balls [dimension member]. XBRL defines two types of dimension:
-
Explicit dimensions - The domain and members are known. The breakdown structure and content is explicitly defined in the taxonomy.
-
Typed dimensions - The domain members are unknown, including the breakdown structure and content. These members may be infinite or impractical to enumerate explicitly in the taxonomy.
You can use an XBRL dimension to add content to a measure value. You can think of them as a categorization or segmentation of concepts. XBRL dimensions use categories to describe how you arrived at a measured value by illustrating semantic relationships between facts and how they have been segmented. For example, if a Revenue concept contains a Region dimension and a Product line dimension, you can reuse the Region and Product line dimensions for other concepts as well. The Revenue concept must choose one value from each dimension. So you can't report Revenue without saying which Region or which Product line is applicable. This would generate a validation error. Some taxonomies specify a "default" which is generally the "domain". So a default for the Region dimension could be "All Regions" and for Product line could be "All Products". With these two defaults in place, a reported "Revenue" with no explicitly mapped dimensions would indicate that you are reporting "Revenue" for "All Regions" and "All Products".
The following image shows the "Default" notation on the Dimension Members tab: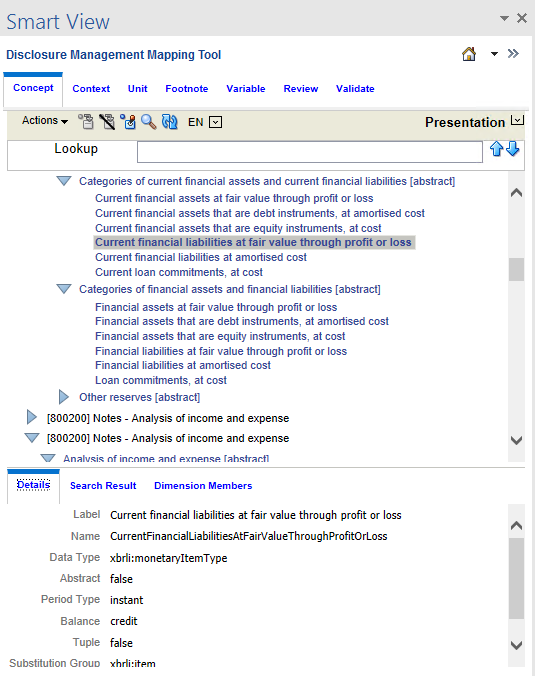
Note:
Using the look-up text in the dimension hierarchy, you can search for any dimensions assigned to a concept.
In the mapping process, dimension members become associated with an XBRL context. As such, the dimension mapping is associated with the concept map and must be mapped after the concept has been mapped to the fact value.
XBRL dimensions are not the same as dimensions in Oracle Enterprise Performance Management System products such as Essbase or Oracle Hyperion Financial Management. While some conceptual similarities exist, no systematic relationships exists between XBRL dimensions. The two should not be confused.
Basic terminology for XBRL dimensions:
-
Hypercube—Expresses a collection of dimensions. The hypercube defines which dimensions are associated with which primary items.
-
Primary Item— A concept that represents a line item in a financial report. When a hypercube is associated with a primary item, it determines which dimensions may be applied.
-
Dimension—Category by which information is reported.
-
Domain and Domain Members—A set of all domain members that are used to express a dimension.
Mapping Primary Items
Once primary items are shown by selecting the Dimension view on the Concept tab, you map primary items in the same way that regular taxonomy concepts are mapped (from the Presentation or Calculation views). Note that primary items are also listed in the presentation and calculation views.
To map a primary item:
-
Open the Disclosure Management report in Smart View Microsoft Office. See Connecting to Narrative Reporting in Smart View.
-
From the Disclosure Management ribbon, click
 .
.
-
On the Disclosure Management Mapping Tool panel, confirm that the Dimension view is selected on the Concept tab.
-
On the document, select the primary item to map.
-
On the Concept tab, click
 .
.
Mapping Domain and Domain Members
After you select a primary item from the top pane, you can map domains and domain members from the dimension tree in the Dimension Members pane. When mapping domain and domain members, note the following:
-
Multiple domains and/or domain members can be mapped from different dimensions to the same fact value. For example, users can map the domain members "Soda" and "New York" to the same fact value.
-
Mapping multiple domain members from the same dimension to the same fact value is not allowed. For example, you cannot map the domains "East" and "West" from the "Regions" dimension to the same fact value.
-
Hypercubes and dimensions are always abstract and Disclosure Management does not allow you to map to Office document data.
-
Default dimensions - Some taxonomies specify a "default" for a dimension which is typically the domain. When the default is the intended dimension value, no dimension mapping is needed. Rather, it is inferred. The following image shows a default notation on the Dimension Members tab:

To map a domain or domain member:
-
Open the Disclosure Management report in Smart View Microsoft Office. See Connecting to Narrative Reporting in Smart View.
-
From the Disclosure Management ribbon, click
 .
.
-
On the Disclosure Management Mapping Tool panel, confirm that the Presentation or Definition view is selected on the Concept tab.
-
On the document, select the domain item to map.
-
Select the domain or domain member.
-
On the Dimension Members tab located on the bottom pane, click
 .
.
Report Level Mapping
When mapping a dimension for a report-level mapping, Disclosure Management allows you to map:
-
The primary item. In the example below, the primary item mapping is made to a cell in the document using the Concept tab:

-
A dimension to an individual cell. The image below shows the selected cell:
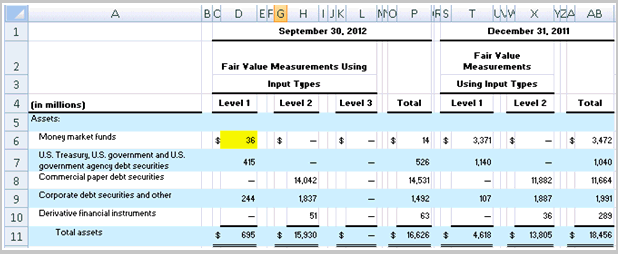
The image below shows the dimension that is mapped to the cell using the Dimension Members tab.
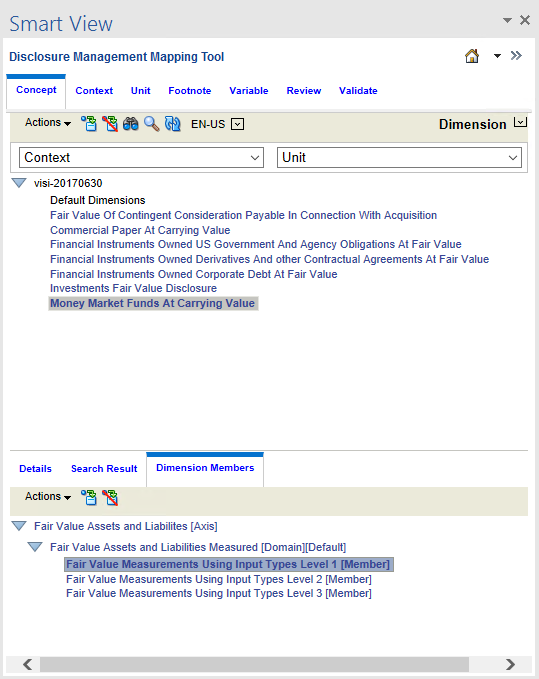
-
A dimension to a selection of cells. The image below shows a group of selected cells.
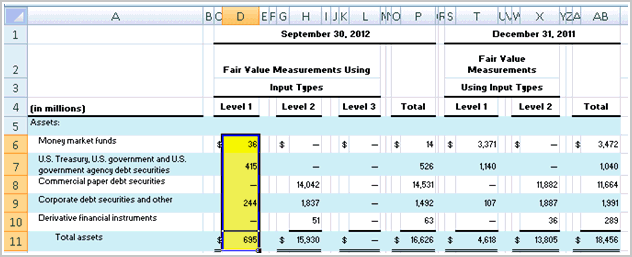
The image below shows the dimension that is mapped to the group of cells using the Dimension Members tab.
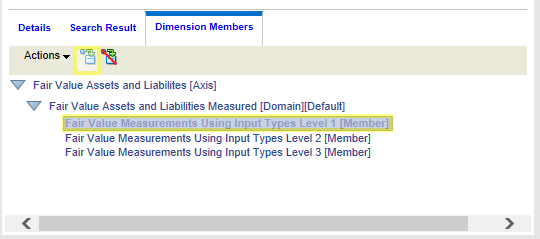
Indirect Data Source Tagging
When working with Excel tables, Oracle recommends that you apply XBRL tags to the Presentation worksheet (sheet1) and reference (link) them to the appropriate worksheet (sheet2) responsible for the data refresh. See Tagging Indirect Data Sources.
Validating Dimension Mapping
To create a dimension map, Disclosure Management requires that the domain/domain member can be associated with a valid taxonomy concept. The XBRL specification for dimensions defines a binding relationship between a taxonomy concept and a domain member.
Prerequisites for creating a dimension map are:
-
Existing Concept Map—You must first map a taxonomy concept before creating a dimension map. Domain and domain member mapping cannot occur on Office data that does not have an existing taxonomy concept map.
-
Primary Item Compatibility—The mapped primary item must be compatible with the given domain or domain member. Every primary item defines the dimensionality that can be associated with it. For example, the domain "East" may be mapped to the data that is also mapped to the concept "GrossProfit". However; "East" should not be mapped to data that is also mapped to the concept "CompanyName". While Disclosure Management lets you create this, it will throw a validation error.
Dimension Map Storage
After you create a valid domain or domain member map to data in an Office document (Microsoft Excel or Word), the Disclosure Management add-in stores information about the mapped dimensionality. This information exists in addition to information about the mapped taxonomy concept, its context, and its unit (for numeric concepts).
Context Management
Disclosure Management enables you to consolidate the contexts that use the same context and dimension combination instead of creating another context per mapped item (that is, a dimension associated with a fact-value). For example, suppose your document is modeled as shown below:

-
Cell B3 has a concept ("Revenue"), a context ("Qtr1"), and a domain ("East") mapped to it. A context is generated that consists of "Qtr1" and "East".
-
Cell B4 has a concept ("Profit"), a context ("Qtr1"), and a domain ("East") mapped to it. This cell uses the same context as cell B3. Disclosure Management does not create a new context for cell B4.
-
The previous example generates four contexts ("Qtr1-East", "Qtr2-East", "Qtr1-West", and "Qtr2- West"). However, there are only two explicitly defined contexts; ("Qtr1" and "Qtr2").
-
The Disclosure Management add-in stores the dimensional information in much the same way as it stores mapped taxonomy concepts, with the corresponding data (in the Office document).
Context Pane
When a context is created, the context pane is updated and shows the list of contexts. All contexts are read-only. However, you can map contexts as any other contexts mapping. For version 1, users cannot rename the auto-generated name for the context that is shown in the Context pane. The name consists of the context name, plus the dimension name as shown in the dimension tree (for example: "Qtr1 - East").
Instance Generation
After the contexts are consolidated, they become actual contexts (for instance documents only). The instance generation routine inserts XML comments above context definitions (within the instance XML) documenting the context's user-friendly name, enabling users to identify the contexts within the instance XML if they choose to examine the XML.
Applying Typed Dimensions
Unlike explicit dimensions, where the breakdown in the taxonomy is known (finite) and listed, Typed dimensions are used when the breakdown structure and content is unknown, infinite or impractical to enumerate explicitly. Typed dimension values are defined by the preparer and are not present in the taxonomy. The preparer can create any number of members as per their reporting entity’s requirement. For example, a typed dimension for "Sales Representation Name" can be reported multiple times for each "Sales" person.
Disclosure Management supports the ability to tag typed dimension meta-values at the document level and from all Disclosure Management supported sources.
After Typed dimensions are defined, they can be mapped, reviewed, validated, rolled over, exported, and published in the same manner as explicit dimensions.
Mapping - requires a primary item mapping, contextual mapping, and (optional) Unit mapping (depending on the data type of the primary item. As financial items tend to be monetary, the user should always map a unit to the primary item to avoid XBRL validation errors.
Creating a Typed Dimension Instance
You open a registered report and select a taxonomy that contains typed dimension definitions, then select a dimension member. Then you create an instance by identifying a primary item located on the Disclosure Management report, map each values associated with the primary item, and then map the entire area of values in the Disclosure Management report associated with the primary item.
To define typed dimension values
-
Open the Disclosure Management report in Smart View Microsoft Office. See Connecting to Narrative Reporting in Smart View.
-
From the Disclosure Management ribbon, click
 to display the Mapping Tool panel.
-
Click the Concept tab navigate to an XBRL concept in the taxonomy containing typed dimension definitions.
-
When an appropriate XBRL concept is selected, the "Dimension Members" tab in the lower pane displays both associated explicit and typed dimensions. Typed dimensions use the Edit Dimension button,
 to identify them.
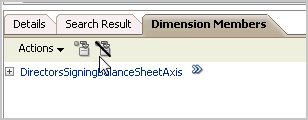
-
On the Dimension Members tab, click a dimension associated with an Edit Dimension button
 .
.
Note:
The Edit Dimension button
 indicates that it is a typed dimension.
All the instances of the typed dimension definitions, if available, display on a typed dimension tab located to the right of the Dimension Members tab.
-
Click
 .
.
-
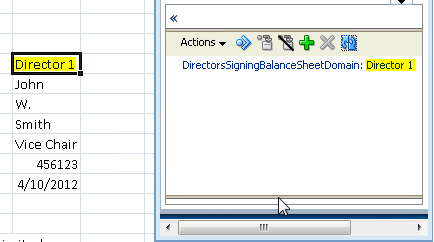
To associate the dimension values to a value header, on the document, highlight the value header, and then click the Capture Value button
 . The image shows selected item.
-
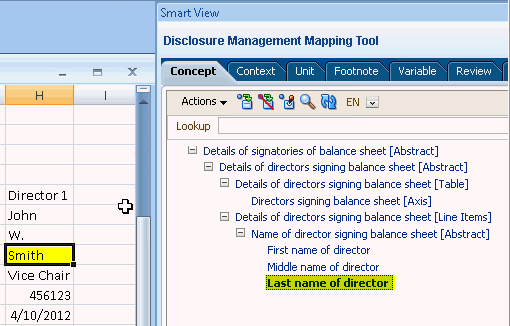
You are ready to map the values associated with the value header. On the Concept tab, select the typed dimension and, on the document select the value you wish to map, then click
 . The mapped item is highlighted.
. -
When you have completed mapping all the values for the selected value header, select the dimension on the bottom pane, select the region in the document that represents the values, and click
 .
. 