Generating a Rule Balancing Report
To generate a Rule Balancing report:
-
From the Home page, select Modeling, and then Rule Balancing.
-
On the Rule Balancing page, click the drop-down and select a Cube.
-
Select the data form that will be used to generate the results displayed on the Rule Balancing page.
The most recently-selected data form is displayed. To select a different data form, click the existing data form to open the Data Form dialog box, and navigate to the desired form.
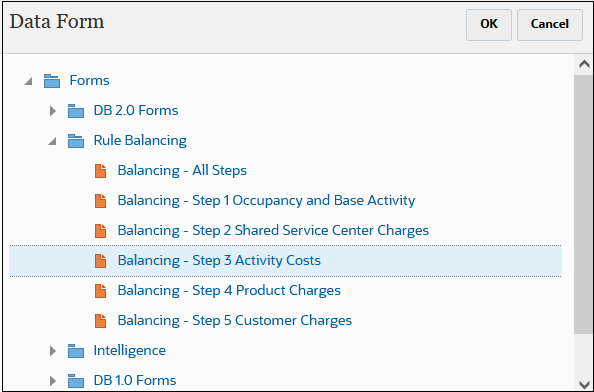
For example, assume you wanted to change the data form from "Balancing - All Steps" to "Balancing - Step 3 Activity Costs". To do this:
-
From the Rule Balancing page, click the link for the existing "Balancing - All Steps" form.

-
In the Data Form dialog box, navigate to the desired form, select the form, and then click OK.

The form you selected is displayed on the Rule Balancing page.

Note that you can click
 next to the data form to analyze or edit the form.
See Using Data Forms with Rule Balancing for detailed information.
-
-
Specify a point of view to analyze by selecting options for the Years, Period, Scenario, and Version POV dimensions.
-
Click Refresh to generate rule balancing information.
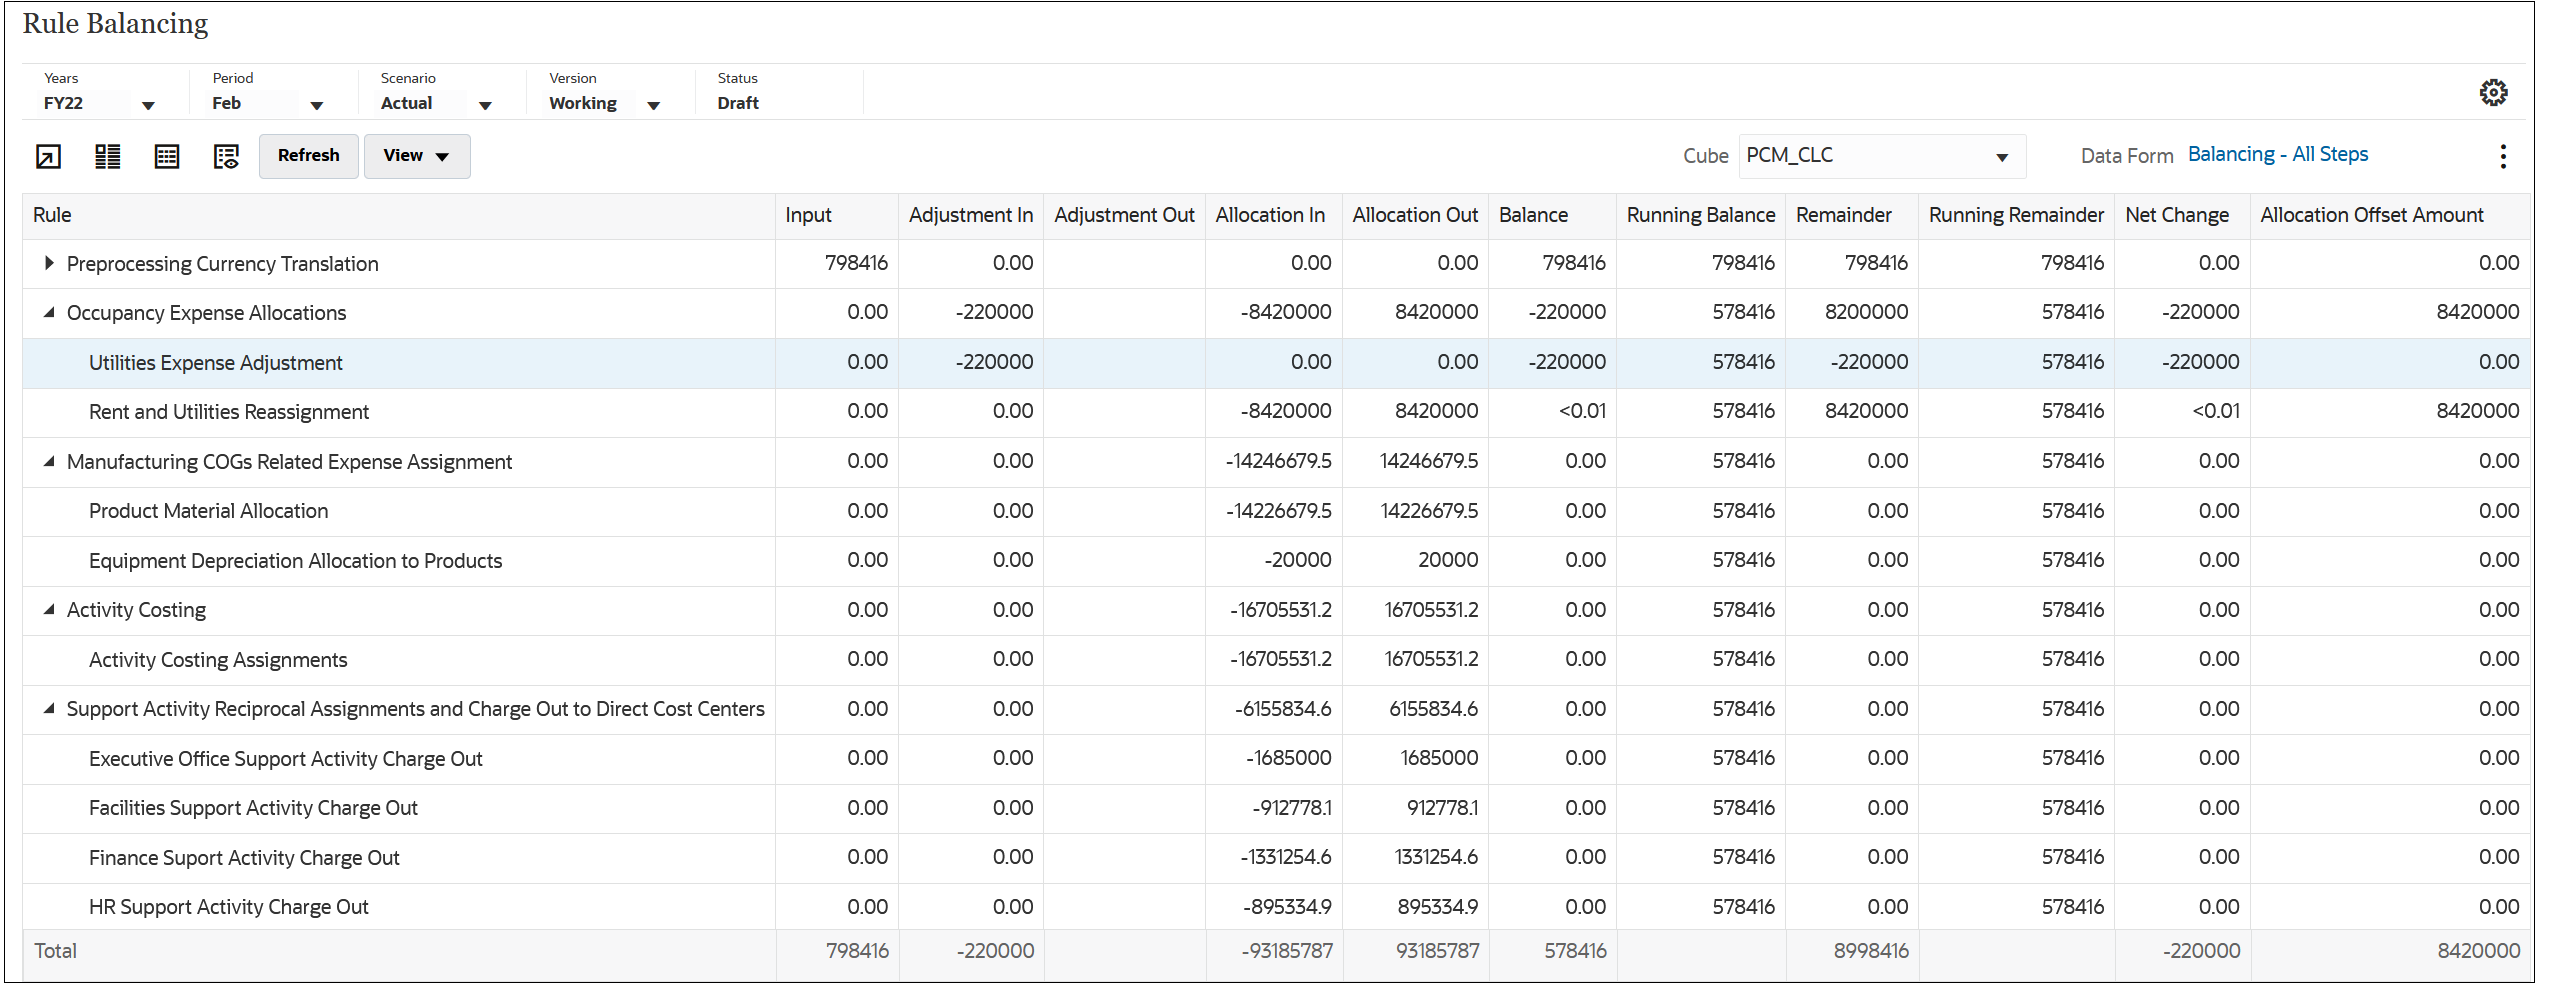
The following is a sample Rule Balancing report generated using the data in the BksML50 sample application provided with Enterprise Profitability and Cost Management. (See Creating the Sample Application for information on how to access the sample application.)

After generating a rule balancing report, you can:
-
Click
 (Export to Excel) to export the Rule Balancing
report to an Excel spreadsheet.
-
Select a rule, and then click
 (View Rule Definition) to view the complete rule
definition for a rule. See Viewing Rule Definitions.
-
Select a rule, and then click
 (View Rule Data Ad-Hoc Grid) to create an ad hoc
grid where you can analyze a preconfigured data slice targeted for a specific
rule's results. See Using Ad Hoc for Data Entry and Analysis.
-
Select a rule, and then click
 (View Rule Data Smart View) to open a
context-sensitive, ad-hoc report in Oracle Smart View for Office. For example, if you
wanted to see what entities were affected by an allocation, you could open Smart View and add more context
to your results, drill down for more detail, and pivot the data. See Downloading and Installing Smart View and Using Smart View to Import and Edit Application Metadata for information on how to
download and use Smart View.