17 Use Key Performance Indicators to Monitor the Efficiency of Fleet Operations

Would it be helpful to be informed of an issue before it causes unplanned down time? Would you like to schedule maintenance at the most cost effective time? Key performance indicator (KPI) and sensor data sent by your fleet vehicles can help you better predict when a vehicle needs maintenance and can prevent unplanned down time. KPIs and sensor data can move you from a reactive operational model to a proactive operational model. Oracle IoT Fleet Monitoring Cloud Service lets you easily connect your fleet vehicles to the cloud, collect real-time sensor data, leverage predictive maintenance, and prevent failures in the field.

What’s a KPI?

A metric or a key performance indicator (KPI) is any measurable value that demonstrates how efficiently your fleet is operating and helps you meet your business objectives. For example, fuel economy or average speed. Sensors and OBD-II data loggers installed in fleet vehicles collect and transmit KPI and sensor data to the Oracle IoT Fleet Monitoring Cloud Service.

The collection of KPI and sensor data for an extended period creates a historical record of operational data. You can analyze current and historic KPI data to predict what is likely to happen in future. KPI data helps you know where to make changes to reduce risk, improve the efficiency of your fleet, and enhance customer service.

Choosing the right KPIs to monitor is dependent on your business objectives and knowing what problems you need to solve. KPIs are typically grouped in three categories: safety, efficiency, and compliance. This table lists the typical KPI categories and provides descriptions and examples for each category.

KPI Category Sample KPI Type Description

Safety

  • Speed violations

  • Driving speed

  • Alerts

  • Incidents

Monitor driver behavior and provide data that you can use to promote and improve driver safety.

Efficiency

  • Consumed fuel cost

  • Idling violations

  • Idling duration

  • Fuel consumed

Monitor operational performance and provide data that you can use to reduce wear and tear on vehicles and maintenance costs.

Compliance

  • Distance driven

Monitor driver behavior and provide data that you can use to ensure compliance with local, municipal, and federal regulations.

Pre-configured Key Performance Indicators

Not interested in coding or hiring a data scientist? That’s not an issue. Every Oracle IoT Fleet Monitoring Cloud Service instance includes a catalog of pre-configured key performance indicators (KPIs) for entities of an organization including trips, vehicles, drivers, and shipments. These out-of-box metrics provide valuable data such as the number of vehicle incidents, the distance a vehicle has travelled, the number of driver speed violations, and more. These pre-configured KPIs let you quickly transform raw data into predictive maintenance insights that you can use to anticipate problems well ahead of failure.

You cannot edit, duplicate, or delete pre-configured KPIs. However, you can display pre-configured KPI data of the entities of an organization on dashboards and KPI ribbons in the map views of the Operation Center.

Custom Key Performance Indicators

If the catalog of pre-configured key performance indicators (KPIs) does not provide the data you need to meet your unique business requirements, use the Design Center to create custom or user-defined KPIs for vehicles, drivers, trips, and shipments of an organization.

You can edit, duplicate, or delete user-defined KPIs. Similar to the pre-configured KPIs, you can display user-defined KPIs on the dashboards and KPI ribbons in the map views that are viewed from the Operation Center.

View the KPI List

View all the key performance indicator (KPI) or metrics of an organization including out-of-box and user-defined KPIs for the entities of the active organization in your Oracle IoT Fleet Monitoring Cloud Service instance. The Edit (Edit icon), Duplicate (Duplicate icon), and Delete (Delete icon) icons are active for custom or user-defined metrics only.

You can view all the metrics of the current organization from Design Center and filter the list based on search criterion.
  1. Click Menu (Menu icon) and then click Design Center.
  2. From te Design Center menu options, click Organization, and then click the Metrics (Metrics icon) icon that appears in the lower section of the organization view.
    Metrics for all the entities of the organization are listed and their details including name, description, category, entity type , and calculation schedule are displayed.
  3. To view specific metrics, click Search Filter and select one of these search options in the list:
    • Description: Select this option to search for a metric having a specific description
    • Type: Select this option to search for metrics of a type such as ad hock, custom, formula,. direct. or custom.
    • Category: Select this option to search for metrics that are either out-of-box or user-defined.
    • Entity Type: Select this option to search for metrics for a specific entity such as vehicles, trips, vehicle types, drivers, shipments, or facilities.

      Note:

      The Shipment business object will be deprecated in a future release. Hence it is recommended to use Trips for real-time monitoring of in-transit movements.
  4. Select one of these secondary options:
    • contains: Select this option to search for metrics containing the search term exactly or partially anywhere in the words in the field and in the same sequence.
    • matches: Select this option to search for metrics containing the exact search terms in the same sequence.
    • does not contain: Select this option to search for metrics containing the search term exactly or partially anywhere in the words in the field and in the same sequence but filtered out from the result set.
    • is: Select this option to search for a metric that includes the search criteria you specify.
    • is not: Select this option to search for a metric that does not include the search criteria you specify
  5. Enter or select the search criteria in the adjacent field, and then click Apply.
    The metrics tat match your filter criteria are displayed.
  6. (Optional) To add an additional search condition, click the Add (Add icon) icon.
  7. (Optional) To remove search conditions, click the Remove (Remove icon) icon.
  8. Click Clear Filter to remove the filter options and view all the metrics.
  9. To return to the organization page, from the breadcrumb information, click Organization.

Create a Formula-Based Custom KPI

Create a custom or user-defined key performance indicator (KPI) for the entities of an organization from the Design Center. You can display KPI data on dashboards or use them in rule conditions.

  1. Click Menu (Menu icon) and then click Design Center.
  2. From the Design Center menu options, click Organization, and then click the Metrics (Metrics icon) icon that appears in the lower section of the organization view.
    Metrics for all the entities of the organization are listed and their details including name, description, category, entity type, and calculation schedule are displayed.
  3. Click Create Metric (Create Metric icon).
  4. Enter a name for the metric in the Name field.
  5. Enter a description for the metric in the Description field.
  6. Select one of these options in the Entity Type drop down:
    • All Shipments: Select this option to create a KPI for all shipments of the organization. For example, a metric that computes the average delay of all shipments.

      Note:

      The Shipment business object will be deprecated in a future release. Hence it is recommended to use Trips for real-time monitoring of in-transit movements.
    • All Trips: Select this option to create a KPI that displays KPI data for all trips. For example, a metric that calculated the total number of incidents raised.
    • All Drivers: Select this option to create a KPI that displays KPI data for all drivers.
    • Vehicles: To create a KPI that displays KPI data for vehicles and vehicle , select the vehicle or vehicle type listed beneath this option245.
    • All Equipment: Select this option to create a KPI that displays KPI data for all the equipment..
    • All Ship Items: Select this option to create a KPI that displays KPI data for the selected type.
    • All Ship Units: Select this option to create a KPI that displays KPI data for the selected type.
  7. For the Metric Type drop down, select Formula Based. For a Duration Based metric, see Create a Duration-Based Metric.
  8. For the Keep Metric Data For drop down, if needed, change the Use Global Setting default option to one of the available options for storing the metric data for that duration.
    For example, if you calculate metrics for a large number of an entity type and the metric data is not required beyond a month, then you can select 7 Days to optimize storage.
    To know how to view or update the global setting from the Settings > Storage Management > Data Management option, see Perform Data Management Tasks.
  9. Under Calculation Scheduling, select one of these options from the Type drop down:
    • Calculate on Demand for All (Shipments/Trips/Drivers): Select this option to generate KPI data on demand for all shipments, trips, or drivers. On-demand metrics are calculated when they are requested and use less computational resources.
    • Calculate on Schedule for Each (Shipment/Trip/Driver): Select this option to generate KPI data on a specific interval for individual shipment, trips, or drivers.
    • Calculate on Schedule for All (Shipments/Trips/Drivers): Select this option to generate KPI data on a specific interval for all vehicles, shipments, trips, or drivers.

      Note:

      You can change the metric type if your business requirements change. For example, you can use an on-demand metric for testing and development and then change it to a scheduled metric when your testing is complete.
  10. For a scheduled metric type, specify a Schedule:
    • Live calculates the metric every two minutes.

      Use this option sparingly, as it may require a lot of computational and storage resources depending on your number of assets. The Live option may be used in special circumstances: For example, when the metric is to be used for anomaly detection purposes.

    • Hourly aggregates the metric for every hour.

    • Daily aggregates the metric for every day.

    • Weekly aggregates the metric for every week.

  11. (Optional) To configure the Data Window, click Edit Edit icon .
    By default, the Data Window is the same as the calculation schedule. For example, if you have set the metric schedule to Hourly, the data from the previous hour is used to calculate the metric.
    You can also use flexible data windows for your scheduled metric calculations. The data window can be different from the calculation schedule. For example, you may wish to compute the total output for the past twenty-four hours, and calculate this metric hourly.
    In addition to sliding data windows, you can also use dynamic custom data windows. For example, you may wish to do an hourly calculation of the cumulative output for the day, starting 9 am. in the morning.
    1. On the Configure Data Window dialog, select one of the following from the App Settings drop down:
      • Default: Uses the default data window as per the selected schedule. For example, if you have set the metric schedule to Hourly, the data from the previous hour is used to calculate the metric.
      • Data Window Start Time: Lets you pick from a number of fixed options. For example, you may use data from the last one week, and calculate the metric hourly.

        When choosing larger data windows, ensure that the data life span settings for your custom metrics are large enough in the application settings, so that there is data available for the selected window.

      • Custom Data Window Start Time: Lets you choose a fixed start time for the data window. For example, you may wish to do an hourly calculation of the cumulative output for the day, starting 9 am. in the morning.

        This option is only available when selecting the Live or Hourly schedule.

    2. Select the Data Window value corresponding to the selected value in App Setting:
      • If you selected Default, the Data Window value is automatically selected to match the metric calculation schedule.
      • If you selected Data Window Start Time, specify the Offset value to be used. For example, choose One Week Ago, to use the data from the past one week.
      • If you selected Custom Data Window Start Time, then specify the fixed start Time for the data window in the UTC (Coordinated Universal Time ) time zone.
  12. Enter a formula for the metric in the Formula area:
    1. (Optional) Click Advanced to directly enter the expression in a text editor.
    2. Click Click here to insert formula to create your KPI formula using the expression builder.
    3. Select an aggregate function in the Aggregations list. For example, select Average if you wish to calculate the average hourly temperature for a sensor.
    4. Click Up (Up icon) to view the Formula menu and select functions, operators, property

      Note:

      If you are using imperial units of measurement, use the ToMetric function, enter the imperial value in the Number field, and then enter a value in the Unit field. For example, enter mi for distance or gal for volume. Additional unit values include: lb for weight, mph for speed, F, for temperature, and mpg for fuel economy.
    5. (Optional) Repeat step d to add additional aggregations, functions, operators, properties, or elements.
    6. (Optional) Click Add Filter to return only the values that satisfy the set conditions.
    7. (Optional) Click Advanced to modify the expression in a text editor. To return to the expression builder, click Basic.
    8. (Optional) Click Validate Formula to validate your formula.
    The following are some examples of formulae:
    • AVG (FuelLevel): Returns the average FuelLevel over the specified time period.

    • MIN(MaxPressure/2 + MinPressure/2): First uses the MaxPressure and MinPressure sensor values to compute the average pressure, and then returns the minimum of this average pressure over the specified time period.

    Your expression can contain the following elements:
    • Parenthesis: Use parenthesis to group operations and indicate precedence.
    • Symbols: You can use arithmetic (+, -, *, /), relational (=, <, >, <=, >=, !=), and logic (AND, OR, LIKE) operators. When you click the Symbol button, the add operator appears in our formula. If you want to select another operator, click the Add icon and select a different operator from the list.
    • Numbers, text, and boolean values.
    • Properties: A list of system attributes, sensor attributes or in-built metrics that you can use to build your own metrics. This list is based on the entity type and function that you selected.

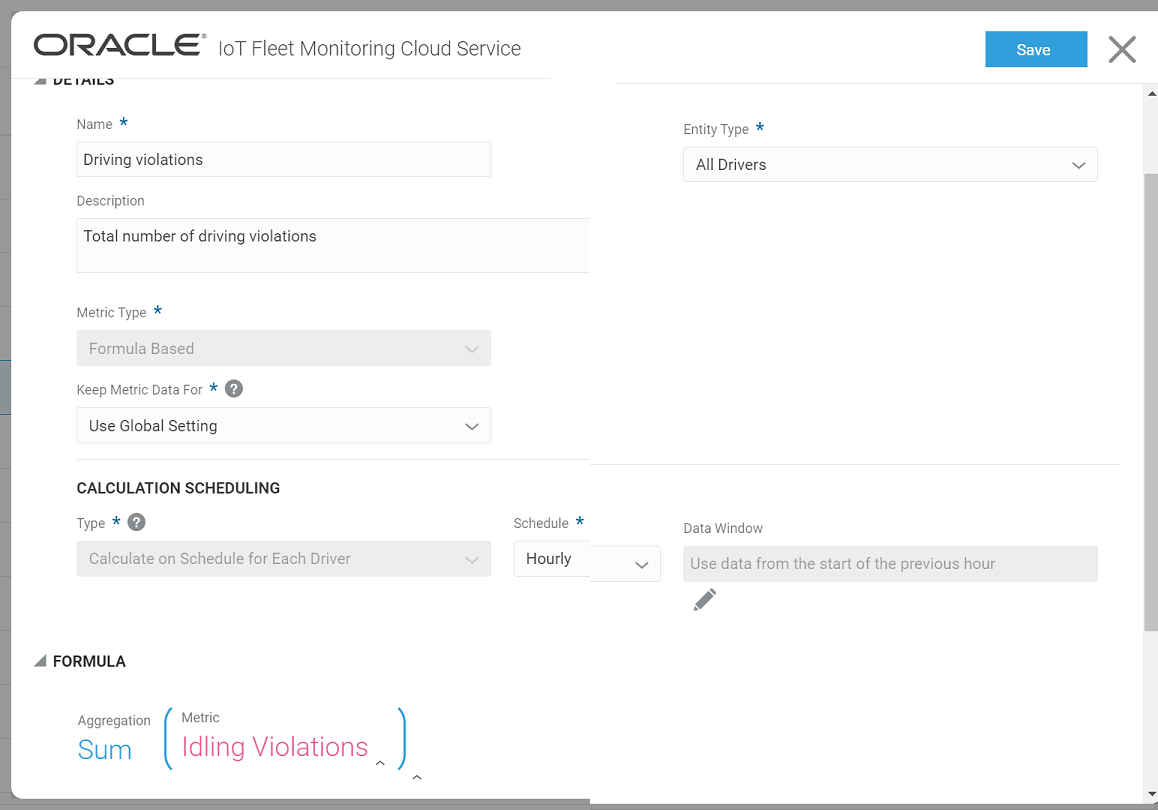
    The following example of the Create Metric editor shows a computed.


    Formula-Based Metric: Described in Text

    The preceding example shows the metric editor for a formula-based metric that calculates the sum of driving violations by using a system-defined metric.

  13. (Optional) Under Testing, click Run Test to view sample metric results on live asset data.

    Note:

    You must successfully validate the formula before Run Test is enabled for you.
    Sampling the metric values lets you validate whether your computations work along expected lines. Sampling also lets you determine if the metric can go live, and if the metric is ready to be used in analytics artifacts, such as predictions.

    Computations are made using live data scheduling. Results may take a few minutes to compute and are available for two hours. Metric results may be shown for a sample selection of assets to cover the range of metric values.

  14. Click Save.
    A Save successful message is displayed.
  15. (Optional) Click Close to return to the metric list.
  16. (Optional) Add the new KPI to the map view ribbon. See Add a KPI to the Fleet and Trip Metrics Ribbon. You can also add the newly created metric to your dashboards, or use the metric in rule conditions.

Create a Duration-Based Metric

Duration-based metrics let you track duration based on the conditions that you specify for an entity. Your conditions can use the vehicle location, sensor attribute values, and other metrics.

For example, the administrator may track the duration for which a vehicle was inactive in a trip. Like other metrics, you can add duration tracker metrics to your organization and trip dashboards. You can also use duration tracker metrics in your rule conditions to generate incidents, warnings, or alerts if the threshold duration is violated.
  1. Click Menu (Menu icon) and then click Design Center.
  2. From the Design Center menu options, click Organization, and then click the Metrics (Metrics icon) icon that appears in the lower section of the organization view.
    Metrics for all the entities of the organization are listed and their details including name, description, category, entity type, and calculation schedule are displayed.
  3. Click Create Metric (Create Metric icon).
  4. Enter a name for the metric in the Name field.
  5. Enter a description for the metric in the Description field.
  6. Select one of these options in the Entity Type drop down:
    • All Shipments: Select this option to create a KPI for all shipments of the organization. For example, a metric that computes the average delay of all shipments.

      Note:

      The Shipment business object will be deprecated in a future release. Hence it is recommended to use Trips for real-time monitoring of in-transit movements.
    • All Trips: Select this option to create a KPI that displays KPI data for all trips. For example, a metric that calculated the total number of incidents raised.
    • All Drivers: Select this option to create a KPI that displays KPI data for all drivers.
    • Vehicles: To create a KPI that displays KPI data for vehicles and vehicle , select the vehicle or vehicle type listed beneath this option245.
    • All Equipment: Select this option to create a KPI that displays KPI data for all the equipment..
    • All Ship Items: Select this option to create a KPI that displays KPI data for the selected type.
    • All Ship Units: Select this option to create a KPI that displays KPI data for the selected type.
  7. For the Metric Type drop down, select Duration Based. For a Formula Based metric, see Create a Formula-Based Custom KPI.
  8. For the Keep Metric Data For drop down, if needed, change the Use Global Setting default option to one of the available options for storing the metric data for that duration.
    For example, if you calculate metrics for a large number of an entity type and the metric data is not required beyond a month, then you can select 7 Days to optimize storage.
    To know how to view or update the global setting from the Settings > Storage Management > Data Management option, see Perform Data Management Tasks.
  9. Select a Mode for the duration based metric:
    • Live: The time duration for which the metric conditions are currently being met. If the metric conditions are currently not met, then the Live value is zero.
    • Last: The time duration for which the metric conditions were last met.

      When the metric conditions go from currently being met to currently not being met, the value of Live is transferred to Last, and the Live value becomes zero.

    • Cumulative: The total time duration of all occurrences when the metric conditions were met.

      For Cumulative, you need to select a Time Window as the cumulative occurrences are tracked over the Time Window you select. For example, if you select Weekly, then the total time duration of all occurrences over the past week is tracked.

    You can select more than one mode if required.
  10. Under Target, based on your selection for the Entity Type field, select All Entity types. Alternatively, select Specific Entity and select one or more specific entity name you wish to monitor.
  11. Under Conditions, create one or more conditions.
    You can create location conditions based on whether an asset enters or exits a location. You can also create threshold conditions based on whether a sensor attribute, or a pre-existing metric, exceeds a set threshold.
    To create a location condition:
    1. Select Location from the drop-down list.
    2. Select Entered or Exited in the second drop-down list:
    3. Select the location in the third list.
      The location is the name of a predefined place that you must have previously created in the application.
    To create a threshold condition:
    1. Select an asset sensor attribute or existing metric from the drop-down list.
    2. Select a threshold condition for the attribute in the second drop-down list.

      For example, a numeric attribute specifies conditions like Greater Than and Less Than.

    3. Specify an attribute value in the third field.

      For example, a complete condition may look like: maxtemp Greater Than 50.

      A complete condition that uses a system metric may look like: sys_openIncidents Greater Than 5.

  12. (Optional) Add additional conditions, as required.
  13. In the Fulfillment section, select an option for the Fulfill when field:
    • All Conditions Apply : Select this option to track the duration when all the conditions are met.

    • Any Conditions Apply: Select this option to track the duration when any of the conditions are met.


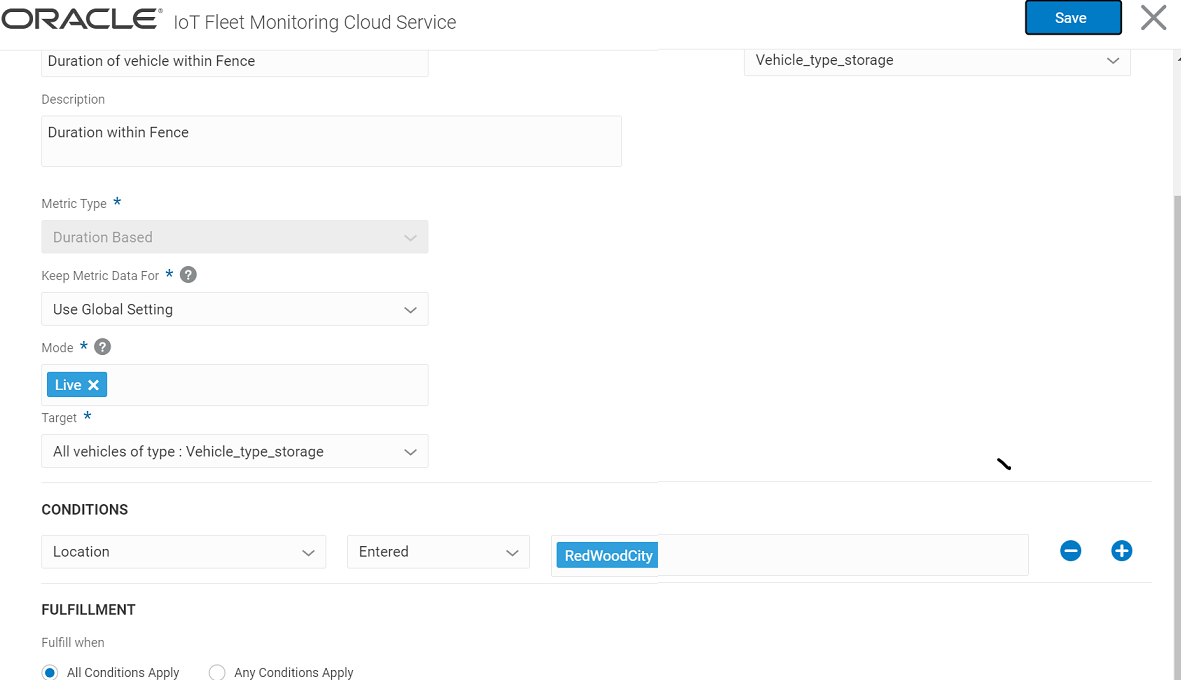
    Duration Based Metric: Described in Text

    The preceding example shows the metric editor for a duration-based metric that checks the duration spent by vehicles of a specific vehicle type within a selected geo-fence.

  14. Click Save.
    A Save successful message is displayed.
  15. (Optional) Click Close to return to the metric list.
  16. (Optional) Add the new KPI to the map view ribbon. See Add a KPI to the Fleet and Trip Metrics Ribbon. You can also add the newly created metric to your dashboards, or use the metric in rule conditions.

Edit a Custom KPI

Edit a custom or user-defined key performance indicator (KPI) to change its name or modify its formula from the Design Center. Pre-configured or out-of-box KPIs cannot be edited.

  1. Click Menu (Menu icon) and then click Design Center.
  2. From te Design Center menu options, click Organization, and then click the Metrics (Metrics icon) icon that appears in the lower section of the organization view.
    Metrics for all the entities of the organization are listed and their details including name, description, category, entity type, and calculation schedule are displayed.
  3. Select the user-defined KPI that you need to modify and click Edir (Edit icon).
    If required, use the Filter (Filter icon) option to search for a specific user-defined metric.
  4. Edit the name of the metric or in the Formula section, edit the formula of the user-defined metric.
  5. Click Save.
    A Save successful message is displayed.
  6. (Optional) Click Back to return to the KPI list.

Duplicate a Custom KPI

Duplicate a custom or a user-defined key performance indicator (KPI) to quickly copy the settings of an existing KPI to a new KPI. Pre-configured KPIs cannot be duplicated.

  1. Click Menu (Menu icon) and then click Design Center.
  2. From te Design Center menu options, click Organization, and then click the Metrics (Metrics icon) icon that appears in the lower section of the organization view.
    Metrics for all the entities of the organization are listed and their details including name, description, category, entity type, and calculation schedule are displayed.
  3. Select a custom KPI in the Metrics list.
    If required, use the Filter (Filter icon) option to search for a specific user-defined metric.
  4. Click Duplicate (Duplicate icon).
  5. Enter a name for the KPI in the Name field.
  6. (Optional) Edit the remaining KPI settings.
  7. Click Save.
    A Save successful message is displayed.
  8. (Optional) Click Back to return to the KPI list.

Delete a Custom KPI

Delete a custom or user-defined key performance indicator (KPI) when it is no longer required. Pre-configured KPIs cannot be deleted.

  1. Click Menu (Menu icon) and then click Design Center.
  2. From te Design Center menu options, click Organization, and then click the Metrics (Metrics icon) icon that appears in the lower section of the organization view.
    Metrics for all the entities of the organization are listed and their details including name, description, category, entity type, and calculation schedule are displayed.
  3. Select a custom KPI in the Metrics list.
    If required, use the Filter (Filter icon) option to search for a specific user-defined metric.
  4. Click Delete (Delete icon).
  5. Click Yes.