Forecasting with Predictive Planning
Predictive Planning uses historical data to predict what your scenario plans might look like in the future. With Predictive Planning, you can see trends and growth rate predictions to validate and update values. You can also adjust and copy projected trends and series points into the Forecast.
You can access and use the Predictive Planning feature on the following forms:
-
Revenue Predictive/Spread (in the Revenue and Gross Margin card)
-
OpEx Predictive/Spread (in the OpEx card)
Use Predictive Planning to review and compare your existing Forecast values against predicted values and to identify trends. Predictions are based on historical Actuals, and you can select the time period for the prediction. You can also adjust Forecast values manually or update them automatically based on the predicted values.
Additionally, use Predictive Planning to paste predicted values into the scenario plan. You can also adjust series points in the prediction before you paste the values to the Forecast.
Predictive Planning Example
The following steps show an example of how to update the operating expense Forecast by using Predictive Planning. The steps you need for your form might differ slightly from what's shown in this example, but the concepts demonstrated apply to your form too.
When you open Predictive Planning for a specific Account, its prediction shows up first. However, predictions are calculated for all Accounts on the form, not only the one you selected. This means that you can click on different rows to see their historical data, and both Actual and predictive trends will appear in Predictive Planning.
To review, adjust, or update a Forecast by using Predictive Planning:
-
From the Home page, click the relevant card. For example, click OpEx.
-
Click the relevant tab on the left-hand side to go to the data entry forms. For example, click the 1 tab to go to OpEx Planning.
-
Click the Predictive/Spread form at the bottom of the page. For example, click OpEx Predictive/Spread.
-
In the Point of View, choose the dimension members that you want to see.
-
Click the Account you want to review to highlight that row.
Note:For the Revenue Predictive/Spread form, you'll need to expand the collapsed Accounts and Customers to see values at the detail level.
-
Click Actions in the upper right of the form, and then select Predictive Planning.
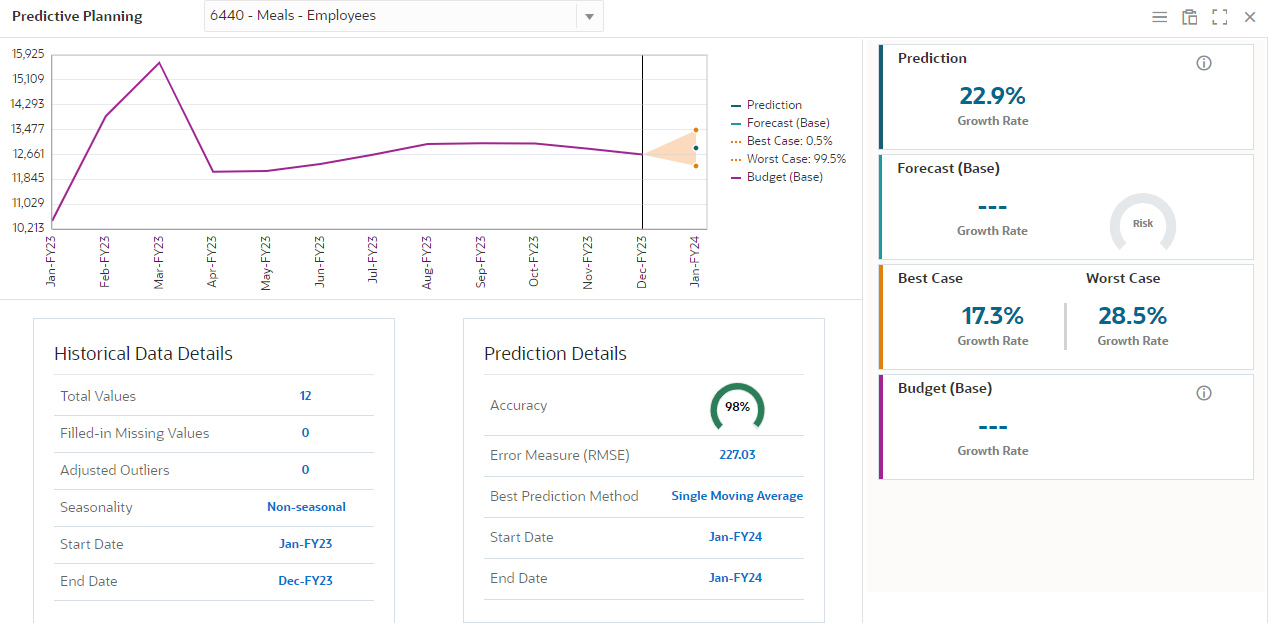
The Predictive Planning pane opens and shows the historical data along with the Actual and predicted trends.
-
Click the Settings icon
 in the upper right of the Predictive Planning pane.
 -
In the Settings popup window, click the Date Ranges tab.
-
Select the historical data range for the prediction by using the Past Start Year, Past Start Period, Past End Year, and Past End Period fields. The Historical Data Range sets the historical time period to use.
For example, if you want to predict based on last year's Actuals, select the start period and year for your last financial year. Then, select the last closed period in the current financial year.
-
Select the prediction range for the prediction by using the Future End Year and Future End Period fields. The Prediction Range sets the future time period to use.
For example, if you want to predict this year and next year's Forecast, select the last period in the next financial year. If your current year starts in January 2020, select December 2021.
Note:The Future Start Year and Future Start Period will automatically default to the period after the past end year and period.
-
Click the Chart View tab. The series types to include in the chart are defined here.
-
Check the Past and Future options that you want to use. You can check more than one box.
-
To save your changes for this session, click Apply.
The chart appears for the selected Account and criteria. Actuals show up to the solid vertical line in the chart, then predicted values show for future periods.
-
-
To see different series data, click the series name in the legend. The legend shows different series types based on what you selected.
-
Click one of the following trends in the legend:
-
Prediction
-
Best Case
-
Worst Case
This series is indicated with a left arrow, the chart grabber, and the series points show on the trend.
-
-
Review the prediction trend compared to the historical trend, and look at the Growth Rate predictions for each legend series in the right panel.
Tip:Hover over each growth rate percentage to see helpful and brief descriptions about the growth rate.
-
To adjust the predictive curve, click the chart grabber arrow
 and drag it up or down to increase or decrease all prediction values. The values adjust relative to the first predicted value.Note:
The first predicted value stays fixed when you drag the chart grabber up or down.
-
To adjust the first predicted period, hover over the chart to see the Unlock First Period icon
 . Click that icon to unlock the first period value.
-
Drag the chart grabber to increase or decrease all values evenly.
-
To lock the first period value to its new position, hover over the chart to see the Lock First Period icon
 , and then click that icon.
-
-
Hover over a series point to see the predicted value for that period.
-
To manually adjust an individual series point, drag that point up or down to the level that you want.
-
To reset the selected series and undo your changes, hover over the graph to see the Reset icon
 , and then click that icon.
 -
When you're satisfied with the predicted values and want to copy the data into the scenario plan:
-
Click the Paste icon
 .
. -
In the Paste Prediction popup window, in the Copy From field, select a trend that you want to copy from.
-
In the Prediction Range field, select which periods to paste into the Forecast.
-
Under Members, choose whether you want to copy only the selected Account member or predictions for all Accounts.
-
Click Paste. The data copies onto the Forecast for the period ranges and members that you selected.
-
-
Click Save to save the Forecast values.
-
To update top-level members with the adjusted data, right-click in the data grid and select Aggregate to Income Statement.