Using the Processor Concurrency Portlet in SuiteCloud Processors Monitor
You can use the Processor Concurrency portlet to spot peaks and gaps in your processing bandwidth. This portlet shows your concurrency count over time.
The portlet's graph changes based on the time range you pick. It shows a line graph if you choose less than seven days, or a heat map if you pick seven days or more.
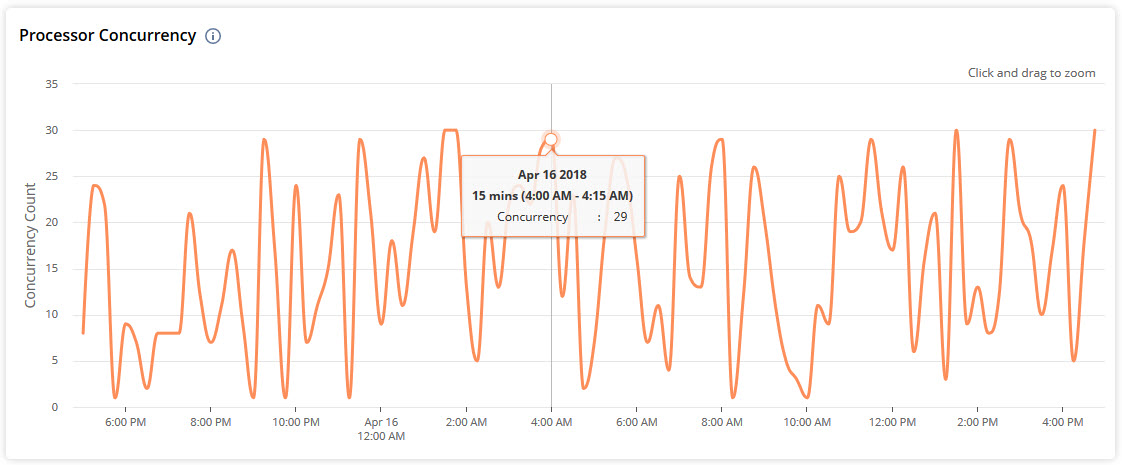
Click any point on the heat map to see a detailed line graph for that time.
Related Topics
- Using the SuiteCloud Processors Monitor Dashboard
- Setting the Date Range in SuiteCloud Processors Monitor
- Using the Overview Portlet in SuiteCloud Processors Monitor
- Using the Processor Settings Portlet in SuiteCloud Processors Monitor
- Using the Wait Time by Priority Portlet in SuiteCloud Processors Monitor
- Using the Elevated Priority Portlet in SuiteCloud Processors Monitor
- Using the Processor Utilization Portlet in SuiteCloud Processors Monitor
- Using the Job Status Portlet in SuiteCloud Processors Monitor
- Using the Queue and Processor Details Portlet in SuiteCloud Processors Monitor