Record Pages Monitor Tiles
By default, the dashboard shows the 10 most used record operations. You can set it to display up to 20 record tiles. For more information, see Changing Watch Lists on Record Pages Monitor.
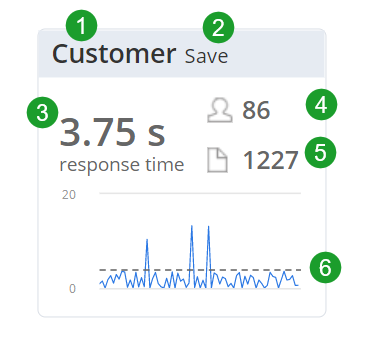
Record operation tiles use a concise format, so you can see key metrics and a small trend graph at a glance. Each tile includes the following information:
|
Tile Element |
Description |
|---|---|
|
1 |
Record type |
|
2 |
Record operation |
|
3 |
Average response time |
|
4 |
Number of users |
|
5 |
Number of instances |
|
6 |
Response time trendline |