Using the Performance Chart
The Performance Chart shows SuiteScript execution data over time. To see more details about the average execution time, hover over a bar on the chart.
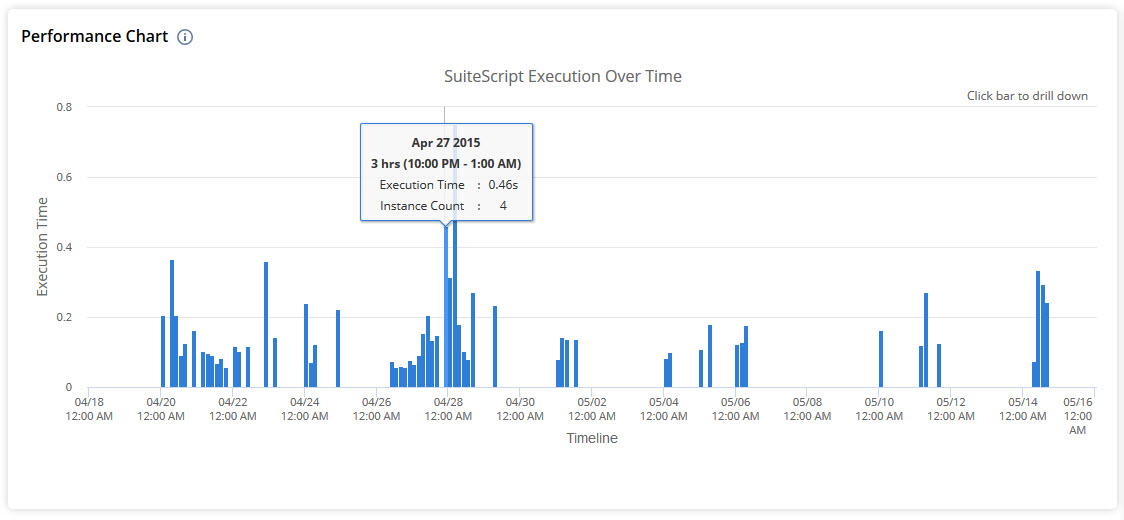
To see execution times for each instance in an hour, click any bar that has more than one instance.
The chart updates and shows execution times for that hour. In this example, response times were higher only from 1:10 to 1:15 p.m.
Click the back button to go back to the main Performance Chart view.