Using SuiteScript Details
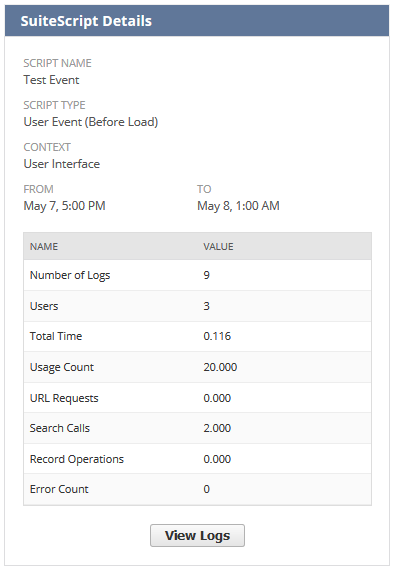
The SuiteScript Details portlet shows the performance chart details. This portlet includes metrics collected during script execution, such as the number of logs, URL Requests, and record operations during the selected time range.
If you're looking at a client script, you'll only see logs for scripts that ran long enough to help you troubleshoot issues. SuiteScript Analysis doesn't track every script and plug-in your account runs.
Some metrics aren't available for client scripts. If you select a client script, usage count, URL requests, search calls, and record operations show as an en dash (-).
To see the individual instances of the processed script and related summary data on SuiteScript Details, click View Logs.
SuiteScript Details Logs
When you click View Logs in SuiteScript Details, the log window opens. The window lists logs for the script or plug-in from the time range you picked. Each log shows the following info:
-
Date and Time - Shows the date and time when the script or plug-in instance ran.
-
Name - Shows the name of the user who ran the script or plug-in during the instance.
-
Email Address - Shows the email address of the user who ran the script or plug-in during the instance.
-
Role ID - Shows the role the user used to run the script or plug-in.
-
Record ID - Shows the record tied to the script or plug-in that ran.
-
Context - Shows where the script or plug-in ran.
-
Total Time - Shows how many seconds the script or plug-in ran (and in instances with multiple executions within the selected time range, shows median time).
-
Usage Count - Shows how many governance units were used.
-
URL Requests - Shows how many URL requests ran.
-
Search Calls - Shows how many searches ran.
-
Record Operations - Shows how many record operations ran.
-
Includes Errors - Lets you know if any errors occurred when it ran.
-
Profiler Details - Lets you click an icon to open the Profiler Details page.