Working with the Project Schedule
The project schedule shown on the Schedule subtab of each project record lets you schedule and manage all your project tasks.
The project schedule is a workspace that helps you examine the overall scope, progress and cost for a project. It also organizes the tasks as parts of the project as a whole and defines how they should work together.
To view a project schedule:
-
Go to Lists > Relationships > Projects and click View next to the project.
-
On the project record, click the Schedule subtab.
The schedule lists all the project's tasks, showing the start date, end date, estimated work, and cost for each one.
The Schedule subtab shows project tasks in the same order as your project plan or work breakdown structure. You can't sort or reorder tasks from the Schedule subtab.
In the View field, you can select various views of the planned tasks for the project, including Planning, Tracking, or Variance views:
-
Planning - The planning view looks at relationships between tasks, start and end dates, and the estimate The calculated end date passes from the parent task to the child task. For example, a parent task has a calculated end date assigned to 5/6/2024 according to the calculated hours of its child tasks. You can set the child tasks to finish no later than 29/12/2023 and the value will change only for the task and its child tasks, not for the parent task.
-
Tracking - The tracking view looks at current task progress and the current estimated task dates versus the baseline dates. The tracking view is best for active projects with ongoing tasks.
-
Variance - The variance view compares the original baseline plan to the current plan highlight changes to tasks over time. These changes, or variances, may be in terms of either the targeted dates, the estimated quantity of work, or both.
You can customize these views or define new views as well. NetSuite remembers your last view and shows it next time you open the page.
You can also view a Gantt Chart to see a visual timeline of your project tasks.
Gantt Chart
On the Schedule subtab, you can click View Gantt Chart to open a new window with a Gantt chart of the project. A Gantt chart is a bar chart that represents the project schedule and clearly illustrates the start, end, milestones, and progress of individual tasks.
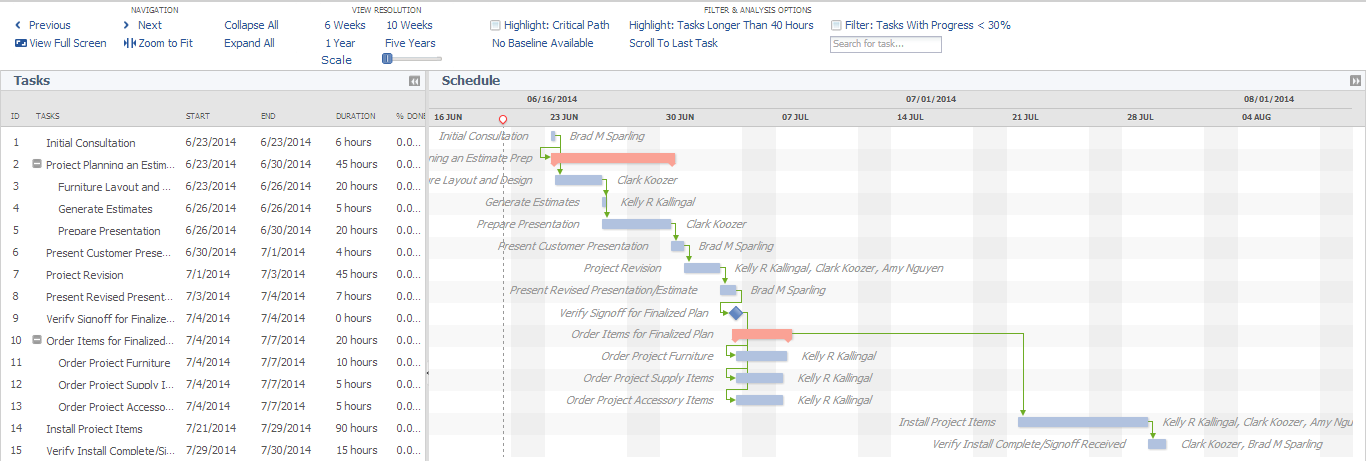
The Gantt chart offers an interface that allows for zooming and scrolling through the project schedule and highlighting important project metrics, such as the critical path.
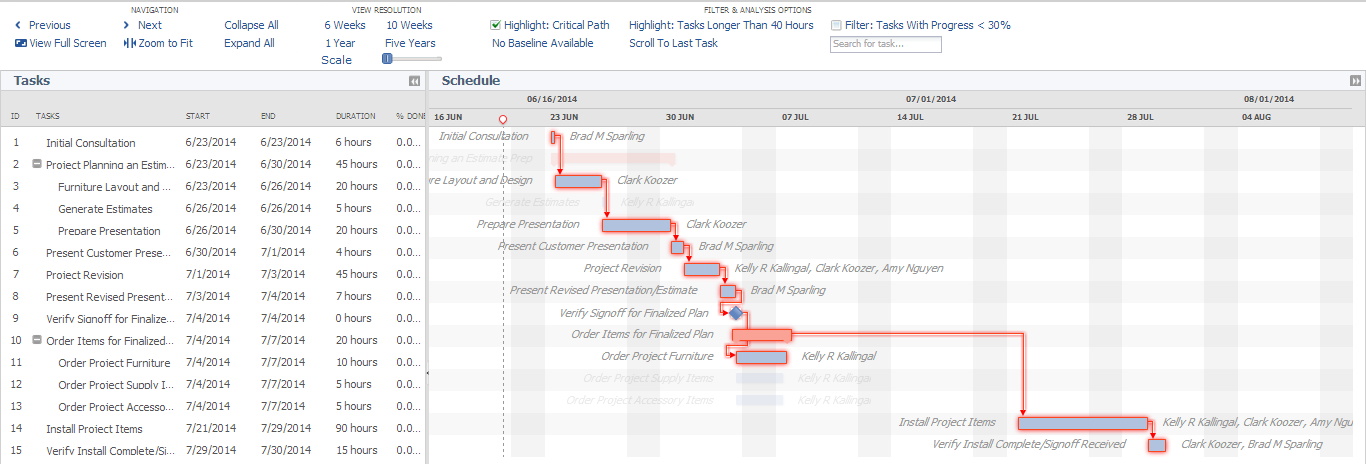
NetSuite calculates the critical path of your project by determining the tasks that must stay on schedule for the project to be completed on time.
You can filter the Gantt chart to show tasks less than 30% complete or highlight tasks scheduled for more than seven days. It's a great visual tool to check project health and keep schedules on track.