KPI Meters
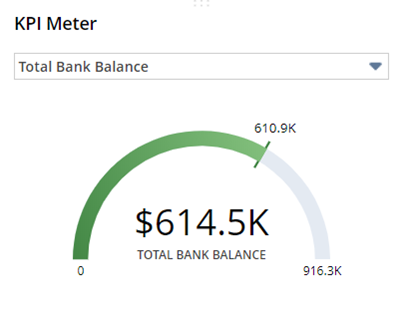
You can add up to three KPI Meter portlets to a dashboard. Each meter visually represents data for one KPI that is displayed in the dashboard's Key Performance Indicators portlet. You can also see the currency symbol of the data for values represented by currencies.
Choices of KPIs for a meter are limited to the KPIs displayed in the dashboard's Key Performance Indicators portlet, plus the following: Actual vs. Forecast, Actual vs. Quota, Forecast vs. Quota, and Forecast vs. Quota (Alt. Sales).
Each KPI meter can show KPI data for one date range, a comparison of KPI data for two different date ranges, or a flagged threshold value. By default, the meter shows comparisons or thresholds if they're set up for the KPI in the Key Performance Indicators portlet. Whenever you change these options in either the KPI meter or the Key Performance Indicators portlet, they are also changed in the other portlet so that the two portlets remain in sync. You can, however, set up different options for the KPI meter, for instance not showing a comparison in the KPI meter portlet but showing one in the Key Performance Indicators portlet.
To set up a KPI Meter portlet:
-
Make sure the KPI you want to show in the KPI meter is listed in the Key Performance Indicators portlet. If it is not listed, click Set Up in the portlet menu. In the Set Up Key Performance Indicators popup, click Add Standard KPIs or Add Custom KPIs, select the KPI, and click Done. Click Save to add the selected KPI to the portlet.
-
To add a KPI Meter portlet to a page, click Personalize Dashboard. In the Add Content Panel, click the KPI Meter icon or drag it onto the dashboard.
-
By default, the KPI Meter portlet displays a graph for the KPI that is listed first in the Key Performance Indicators portlet. To change the KPI that the meter represents, select another KPI from the portlet's dropdown list.
If you select Actual vs. Forecast, Actual vs. Quota, Forecast vs. Quota, or Forecast vs. Quota (Alt. Sales), the following message may appear: 'No data available for this portlet.'
This message means you need to add one or both of the underlying KPIs to the Key Performance Indicators portlet to see the KPI meter.
To display this meter...
Add these KPIs to Key Performance Indicators Portlet:
Actual vs. Forecast
Sales, Forecast (Alt. Sales)
Actual vs. Quota
Sales, Quota
Forecast vs. Quota
Forecast (Alt. Sales), Quota
Forecast vs. Quota (Alt. Sales)
Forecast (Alt. Sales), Quota (Alt. Sales)
To add these KPIs to the Key Performance Indicators portlet, click Set Up in the portlet menu, click the Add Standard KPIs button, select each KPI from the box, click Done, and click Save. For more information, see Setting Up the Key Performance Indicators Portlet.
-
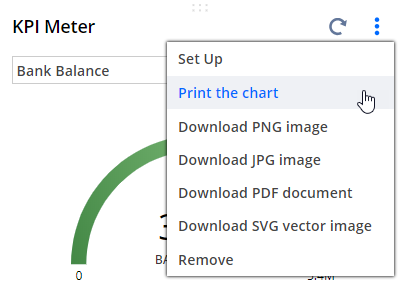
To change the meter's settings for showing comparison or threshold highlighting, click Set Up in the portlet menu, make changes in the Set Up KPI Meter popup, and click Save.
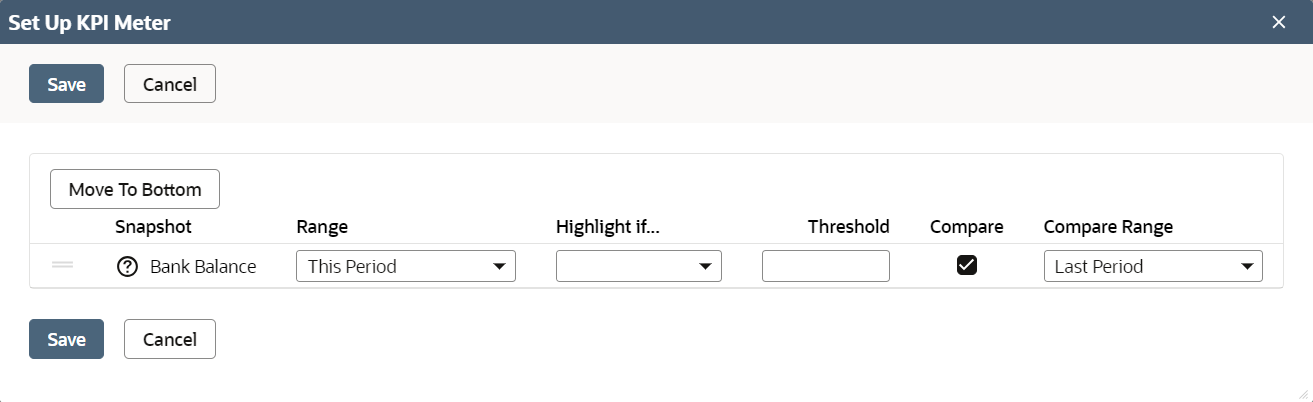 Note:
Note:For visual purposes only, the KPI Meter displays a different number than the threshold. For positive numbers, the maximum number displayed is higher than the threshold. For negative numbers, the maximum number displayed is lower than the threshold.
You can also print the KPI Meter or download it as a file using the portlet menu options.
You can change the position of the KPI Meter portlet on your dashboard by dragging it to a different location. For more information, see Arranging Dashboard Portlets.
If you have selected a custom KPI to display in a KPI meter and its results do not look correct, the saved search on which the custom KPI is based may not satisfy related requirements. The saved search definition must:
-
Not include any date fields defined as filters on the Criteria subtab.
-
Have only one field with a summary type (such as group, sum, or count) defined on the Results subtab.
-
Have a date field defined as an available filter on the Available Filters subtab.
For more information, see Custom KPIs.