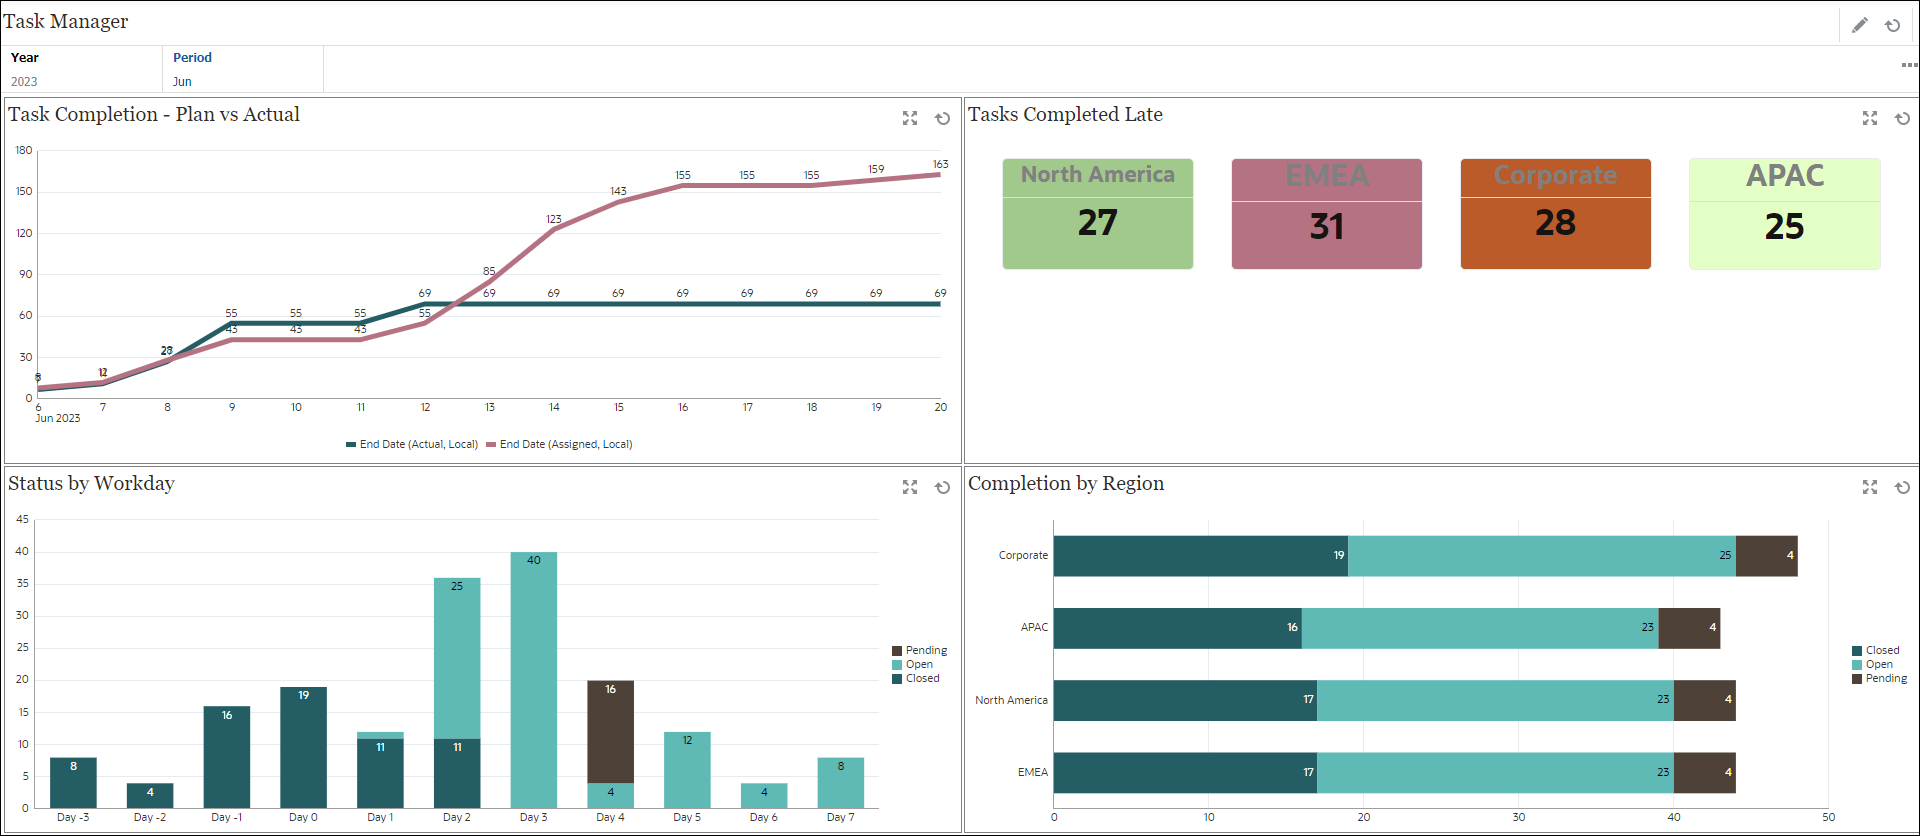
Example: Task Manager Operational Dashboard
This example shows how to create a dashboard.
The dashboard uses these views for Task Manager:
- Chart View: Task Completion - Plan vs Actual
- Chart View: Tasks Completed Late
- Chart View: Status by Workday
- Chart View: Completion by Region
The completed dashboard is shown in the screenshot. You can click any area in any view to drill down into the individual records that comprise that area.

In this example, to create the dashboard:
-
From Home, select Library, and then click Operational Dashboard.
The existing operational dashboards are displayed.
-
Click the New icon to create a new dashboard.
A new dashboard is created with a default name and is opened in a new tab.
-
Click the Settings icon for the dashboard and update the properties on the Properties tab:
- Name: Task Manager
- Borders: Select this checkbox
- Global Filter Bar: Select this checkbox
- Background: No fill
- Layout:
- Grid: Select this check box.
- Horizontal Split: 50
- Vertical Split: 50
- To create the chart view on the top left, see Chart View: Task Completion - Plan vs Actual.
- To create the chart view on the top right, see Chart View: Tasks Completed Late.
- To create the chart view on the bottom left, see Chart View: Status by Workday.
- To create the chart view on the bottom right, see Chart View: Completion by Region.
- Click Save to save the dashboard.