Monitoring User Activity
As described in Oracle Database Performance Method , database time (DB time) is an indicator of the total database instance workload. The average active sessions for a time period equals the total database time of all user sessions during the period divided by the elapsed time (wall-clock time) for the period.
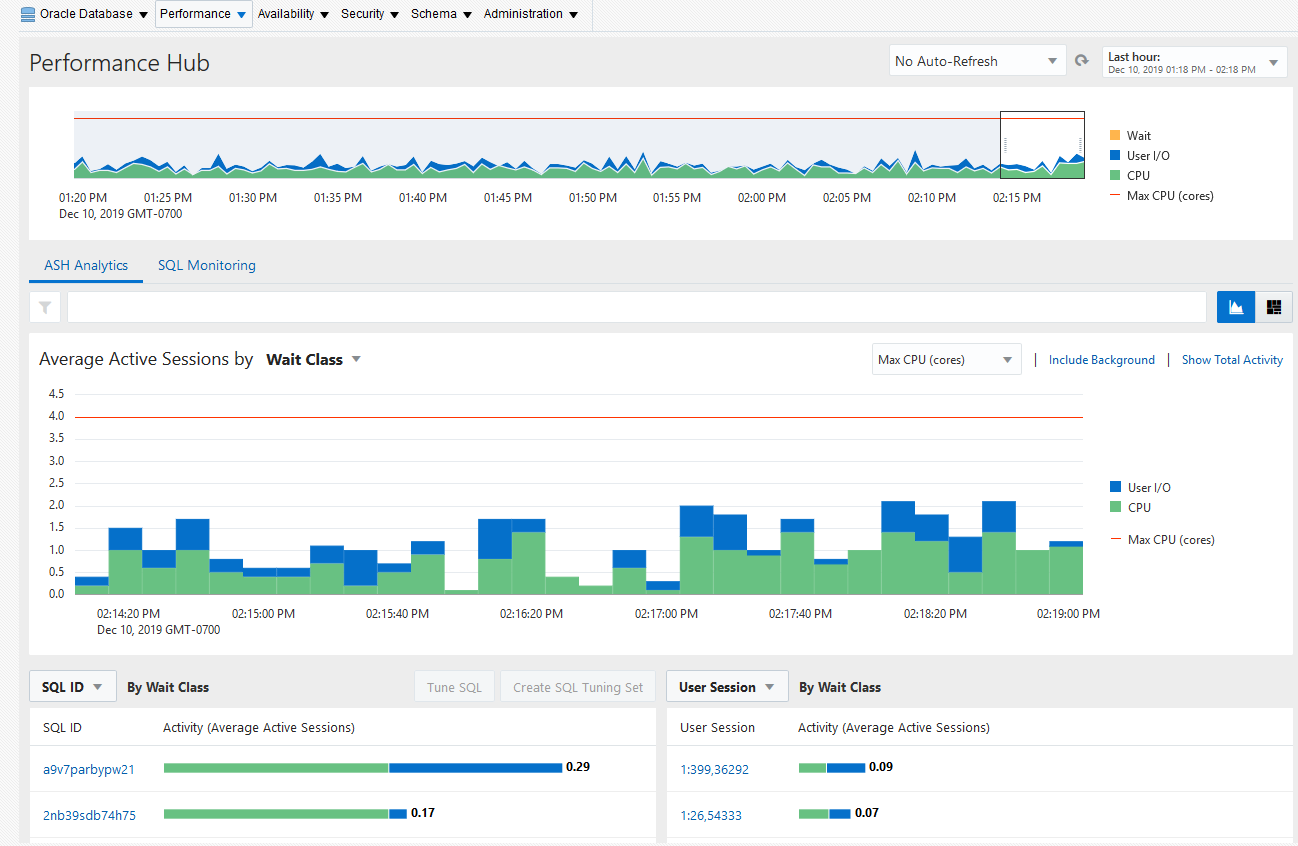
The Average Active Sessions graph on the Performance Hub page shows the average active sessions for CPU usage and wait classes in the time period. You can drill down by clicking on the graph to identify the causes of instance-related performance issues and resolve them.
To monitor user activity:
-
Access the Database Home page.
See "Accessing the Database Home Page" for more information.
-
From the Performance menu, select Performance Hub and ASH Analytics.
If the Database Login page appears, then log in as a user with administrator privileges. The Performance Hub page appears.
-
Locate any spikes or other areas of interest in the Average Active Sessions stacked area chart.
Figure 4-1 shows an example of one dimension of the Average Active Sessions chart on the Performance Hub page.
Figure 4-1 Average Active Sessions by Wait Class

Description of "Figure 4-1 Average Active Sessions by Wait Class"Each color-filled area on the stacked area chart shows the average active sessions for the specified event at the specified time. In the chart, the average active sessions amount for each event is stacked upon the one below it. The events appear on the chart in the order shown in the legend, with CPU starting at zero on the y-axis and the other events stacked in ascending order, from CPU Wait to Other. The wait classes show how much database activity is consumed by waiting for a resource such as disk I/O.
The CPU Cores line at 2 on the y-axis indicates the number of CPUs on the host system. When the CPU value reaches the CPU Cores line, the database instance is consuming 100 percent of CPU time on the system.
The last item in the graph title Average Active Sessions by Wait Class is a drop-down menu for other dimensions to view the performance. Wait Class is the default.
The main dimensions are:
- Wait Class
- Wait Event
- Instance
- Service
- Module
- Action
- User Session
- SQL ID
The Active Sessions Working page shows a 1-hour timeline. Details for each wait class are shown in 5-minute intervals.
You can view the details of wait classes in different dimensions by proceeding to one of the following sections:
-
To change the selected time interval, use the Performance Hub view and drag start and end times to a different interval.
Figure 4-2 Average Active Sessions by "Wait Class"

Description of "Figure 4-2 Average Active Sessions by "Wait Class""The information contained in the Average Active Sessions is automatically updated to display the selected time period.
If you discover a performance problem, then you can attempt to resolve it in real time. On the Performance page, do one of the following:
-
Below the Average Active Sessions chart, click the snapshot corresponding to the time when the performance problem occurred to run ADDM for this time period.
For information about ADDM analysis, see "Reviewing the Automatic Database Diagnostic Monitor Analysis".
-
Click Run ADDM Now to create a snapshot manually.
For information about creating snapshots manually, see "Creating Snapshots". For information about running ADDM manually, see "Manually Running ADDM to Analyze Current Database Performance".
-
Click Run ASH Report to create an Active Session History (ASH) report to analyze transient, short-lived performance problems.
For information about ASH reports, see "Active Session History Reports".