Understanding the Notifications Indicator
The Notifications bell indicator ( ) will be visible in the banner if you are logged in as a user type that receives (or creates) Notifications.
 Note: The type of notifications visible also depends on your permission.
• The bell icon will display the number of unread notifications, if any exist. The background color will depend on the unread notifications' category priority.
• The product standard notification categories are:
Category | Color | Icon |
|---|---|---|
Info: An information notification. | Blue |  |
Warning: A warning notification. | Orange |  |
Critical: A critical notification. | Red |  |
Crew Contact: A critical notification that you need to contact the assigned crew. | Red |  |
ERT beyond current: A warning that the event duration has exceeded the estimated time of restoration. |  |
Understanding the Notifications List
Clicking the Notifications button () opens the Notifications list, which may be displayed from a slide out panel (drawer) on the side of the Flex Operations window or from a dialog box that opens on top of the Flex Operations page (depending on the choice in the list settings or your system's standard configuration).
) opens the Notifications list, which may be displayed from a slide out panel (drawer) on the side of the Flex Operations window or from a dialog box that opens on top of the Flex Operations page (depending on the choice in the list settings or your system's standard configuration).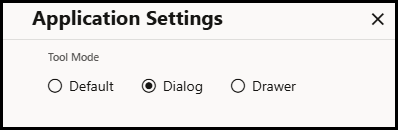
Notifications List Actions
The Notifications list includes a Mark All Read button and a Create Notification button for users with Edit permission (for example, the Flex Call Administrator user type; see Understanding User Types for more information.).
Notification Row Actions
• Each unread notification row will include a small filled circle on the left ( ), which will disappear when the notification is read (or the Marked All Read button is clicked).
• Call Entry notification rows include Edit ( ) and Delete buttons for performing respective actions.
• Event-type notifications include Open Event ( ) and Clear Notification (
 ) options.
) and Clear Notification () options.Editing and Creating Notifications
• Clicking Edit or Create opens a drawer with editing options and buttons that allow you to Save or Cancel edits to the notification.
Deleting Notifications
• Clicking the Delete button ( ) opens a confirmation dialog box with Delete and Cancel options.
Marking All Read
• Clicking Mark All Read marks all notifications as read and closes the notifications drawer.
Understanding the Tool Selector
The Tool Selector ( ) provides a drop‑down list of tools that you may open or switch between. The options for a Full Operations plus Switching user type are:
• Events and Crews: Opens the Events List and the Crews List; see Working with the Events and Crews Tool.
• Substation Alarm Overview: Opens the Substation Alarm Overview tool for a substation. See Understanding the Substation Alarm Overview in this chapter.
• Authority: Opens the Authority dialog box, which allows you to subscribe or unsubscribe from control zones; see Using the Authority Dialog Box.
• Abnormal Device Summary: Opens the Abnormal Device Summary tool; see Understanding the Abnormal Device Summary.
• Safety Documents: Opens the Safety Documents list; see Understanding Safety Documents in Flex Operations.
• Feeder Load Summary: Opens the Feeder Load Summary page; see Understanding the Feeder Load Summary.
• Outages Summary: Opens the Outages Summary tool; see Understanding the Outages Summary in Flex Operations.
Note: To close a tool, click the Close button ( ) on the tool's tab or in the tool's title bar.
 Understanding the DERMS Client Tool Selector
For the DERMS and Edge DERMS user types, the Tool Selector combines Grid DERMS and Edge DERMS tools under four workflow categories, in this order. The available entries depend on your licenses, permissions, and system configuration.
Dashboard and Monitoring
• Network Model (Map): displays the network map.
• DERMS Dashboard: displays DERMS monitoring and forecast information.
• Events: opens the Work Agenda Event List.
• Feeder Forecast (FLM): opens Feeder Load Management.
• Switching Sheets: opens the Switching Sheet List.
• Alerts: displays active Edge DERMS alerts.
• Alert History: displays Edge DERMS alert history.
Non-Wire Alternatives
• Economic Peak Shaving: opens DERMS event planning with the Economic Peak Shaving filter selected.
• Virtual Power Plant (eVPP): opens edge virtual power plant management.
• Smart Inverter Control: opens the Edge DERMS smart inverter controls.
• Demand Flexibility (DRMS): opens the Edge DERMS events list.
• Demand Flexibility Strategies: opens the Edge DERMS strategies list.
Market Participation
• Day-Ahead Market: opens day-ahead-market DER group management.
• Network Capacity Allocation: opens DERMS event planning with the Network Capacity Allocation filter selected.
• DER Contracts: opens the DER contract rules table.
• Realtime Market Participation: opens DERMS Automatic Generation Control (DAGC) group management.
• Operating Reserve: opens Edge DERMS operating reserve.
Configuration
• Authority: opens the authority subscription dialog box.
• DER Objective Management: opens Grid DERMS device objective management.
• DER Groups: opens Grid DERMS DER group management.
• Edge Resource Groups: opens Edge DERMS resource group management.
• DERMS FEP Management: opens Edge DERMS front-end processor management.
• Edge Configuration Assistant: opens the Edge DERMS configuration tool.
• BTM DER Search: opens the behind-the-meter DER search tool.
Demand Flexibility (DRMS) and Demand Flexibility Strategies provide access to the Edge DERMS events and strategies described in Chapter 30, Edge DERMS.
Planning Economic Peak Shaving and Network Capacity Allocation
Select Economic Peak Shaving under Non-Wire Alternatives or Network Capacity Allocation under Market Participation. Both entries open the DERMS event-planning list. Economic Peak Shaving initially selects the Economic Peak Shaving filter; Network Capacity Allocation initially selects the Network Capacity Allocation filter.
Use the list filters to change the objective shown. Select All to view plans for all supported objectives, or select Economic Dispatch to view economic-dispatch plans. The launcher entry's name does not restrict which plans can be displayed after the filter is changed.
Choose New Plan to create a plan. When an objective-specific filter is selected, the new plan's Objective is pre-populated to match that filter. If you select All, choose the Objective in the new plan. Review the objective before saving.
The two launcher entries provide access to the planning list formerly opened as Grid DERMS Event Planning. They are separate from Demand Flexibility (DRMS), which opens Edge DERMS demand-response events.
Understanding the User Menu
The User menu provides the following options.
• About: Displays version and other application information.
• Settings: Launches a Settings dialog box that allows you to configure the appearance or behavior of certain user interface elements.
• Accessibility Mode: When selected, enables features to improve the accessibility of the application, such as modifying keyboard navigation and optimizing for screen readers
• Dark Theme: Switches the user interface to a dark theme, which is suitable for low light conditions. This setting is saved with your user preferences.
• Dark Theme Applies to Drop Downs and Popups: When selected this also applies the dark theme to popup elements of the UI such as menus and tool-tips.
• Reduce Banner Height: When selected, this option removes the colored strip beneath the banner section to allow more screen space for tools.
• Time Zone: Allows the times shown in the UI to be presented in the users chosen time zone. This will default to the time zone of the machine that Flex is running on.
• Alternate Row Coloring: When selected, data table rows will have alternating colors.
• Allow Clicking Table Headings to Sort: When selected, you can click the column heading to sort the table on that column. If it is not selected then you must use the Sort button on the Sort/Quick Filter toolbar that is displayed beneath column headings when they are hovered with the mouse or touched on a touch enabled device. See Understanding Table Sorting and Understanding Table Filtering for more information on sorting and filtering tables.
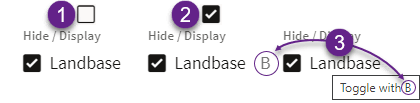
• Show Shortcut Text on Checkboxes/Radio Buttons: When selected, check‑boxes and radio buttons will show an associated shortcut key in their label, if one exists. This setting allows you to disable the label shortcut text if you feel you are familiar enough with them. For example, in the illustration below, the Map Hide/Display Landbase option is not showing a shortcut when the check‑box (from this Settings option) is deselected [1] and showing the shortcut (B) when the check‑box is selected [2]; any configured shortcuts for check‑boxes and radio buttons will always be shown in the tooltip if hovered with the mouse [3].
• Thicker Scroll Bars: When selected, makes vertical and horizontal scroll bars wider than their default. This setting is saved with your User Preferences.
Note: If you are using a mouse with a scroll wheel, it is generally faster to scroll through the table. See Scrolling Using a Mouse Scroll Wheel.
• Diagnostics:
• Diagnostic Log: Displays a log screen that lists error messages and other useful diagnostic information.
• Download Diagnostics: Downloads a file containing diagnostic information, including log files. Use this option when you encounter issues, so you can capture important diagnostic details to share with Oracle for troubleshooting and resolution.
• Logout: Logs you out of Flex Operations.
Understanding the Tabbed User Interface
You can toggle between tools by using the tabs at the bottom of the Workspace. Most tools open a tab at the bottom of the Flex Operations client workspace.

You may switch between tools by clicking the tool's tab. For some tools, when you open a different instance (such as an event or switching sheet), the tab updates with the identification of the current instance; for example, if you have Event 1284 open in Event Details, and then open Event 1285, the tab will update to Event 1285 and load that event's data.
Starting Multiple Instances of a Tool
Details Tools
Details tools such as event details or switching sheets by default reuse existing tools of the same type to keep the number of open tools and resources used by the application to a minimum. If you want to view the details of multiple objects at the same time this can be accomplished in one of two ways:
1. By "pinning" an existing instance of the tool by toggling the "Pin these details open so they will not be overwritten by other details" button ( ) on the title bar of the tool. This will prevent it from being overridden, so that the next time details are requested they will be shown in a new instance of the tool.
2. By middle clicking any action which will open a details display, mirroring the behavior of clicking links in a browser, which will always open a new tab/window rather than navigate within the current tab/window.
Only one instance of the details of a specific object can be opened at any one time. If an attempt is made to open a new instance of details that are already open, the existing tool will be shown instead.
If multiple instances of a details tool are visible then the "main" instance of a tool will be indicated with a star in its tab and title bar. This is the instance of the tool which will be replaced next time details are requested, and is also the only instance of the tool where changes to user preferences (such as column layout of tables) will be persisted.
Other Tools
For non-details tools you can open a new instance in one of two ways:
1. By selecting New Window from the File menu.
2. By middle clicking the entry for the tool in the tool selector drop‑down list in the banner of the workspace.
Once a new instance has been displayed its title (and the title of any other tools of the same type) will be updated with a number to make it unique amongst the set of tools of the same type. User preferences for each instance of the tool will be persisted per-instance, so each instance of the tool can have different settings (for example, column layouts, active filters, and other settings).
For details tools that have an association with a specific summary tool (such as Events and Crews and Event Details or the Switching List and Switch Sheet Details), each tool will maintain a separate "main" instance of its associated details display.
In order to assist with the organization of tools in the tabs at the bottom of the workspace, tools with the same instance number will be grouped together, so Events and Crews 1 and Map 1 will come before Events and Crews 2 and Map 2. Also, details tools will be shown to the right of their associated summary list tool.
Showing Tools in a Separate Browser Window
Tools can be popped out of the main workspace into separate browser tabs/windows using the "Pop this tool out to a separate browser tab/window" button ( ) in the tools title bar.
Once a tool has been popped into a separate browser tab/window this choice will be remembered for the specific instance of the tool. Note that if the tool is a details tool this choice is only remembered for main instances of the tool.
Tools can be popped back into the main workspace using the "Move this tool back to the main browser tab/window" button ( ) in the tool title bar.
Understanding Common User Interactions
Using Keyboard Shortcuts
Many buttons and tabs have keyboard shortcuts. Hover over the component to display the shortcut.
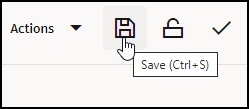
Many single-action dialogs that allow text entries also provide a Ctrl+Enter shortcut to save the text and confirm the dialog.
Setting Font Size
The font size in Flex Operations is tied to the browser magnification. Change the font size by holding down the Ctrl key and rolling the mouse wheel toward or away from you.
Scrolling Using a Mouse Scroll Wheel
Vertical Scrolling
Use the scroll wheel to scroll vertically (up and down) through a list.
Horizontal Scrolling
Press and hold the Shift key while turning the scroll wheel to scroll horizontally (side to side).
Understanding Common Table Features
Understanding Table Components
The following list describes the common table components.
 ); see
2. Filter and Selection History ( ) shows a list of recent filters, which may include Column Quick Filter additions, and selected rows. See Understanding Quick Filters for more information on column filters.
3. Disable Filtering button ( ) temporarily disables (removes) currently applied filters; clicking the button again restores the filters.
4. The applied filter name (for example, To Do & In Progress).
5. Column Filter results shows the column being filtered and the number of rows that meet the column filter criteria; see Understanding Quick Filters.
6. Reset All Column Filters button ( ) removes any quick filtering selections; see Understanding Quick Filters for more information.
 7. Save the Current Filters button ( ) allows you to save the combination of the filter and column quick filter criteria.
8. Filter results; see Understanding Table Filtering for details.
9. The table Search button. See Understanding Searching in Tables for details on using the Search feature.
10. The Reading Pane Options button allows you to show the reading pane for a table and change where the reading pane appears.
11. The header row check‑box allows you to select all of the table rows.
12. The column sort arrow icon shows the current sort direction for that column; clicking it will sort the table by that column. See Understanding Table Sorting for details.
13. The column filter button ( ) appears on any column being used in a quick filtering. When you click the button, the values available to filter on are listed allowing you to modify the quick filter; see Understanding Quick Filters.
 Changing Column Order and Display
There are a number of options to reorder (move) and hide columns.
• Select a column heading and drag the column to its desired new position.
• Right click a column header and select Hide Column to hide the column.
• Right click a column header and choose Organize Columns... to open the Columns dialog box that allows you to reorder and hide columns.
• Hide or show columns by deselecting or selecting them, respectively.
• Reorder columns by dragging the column row up or down the list.
• Use the positioning buttons to move the column to the top of the list (first column in table), up one position (left in table), down one position (right in the table), or to the end (last column in the table).
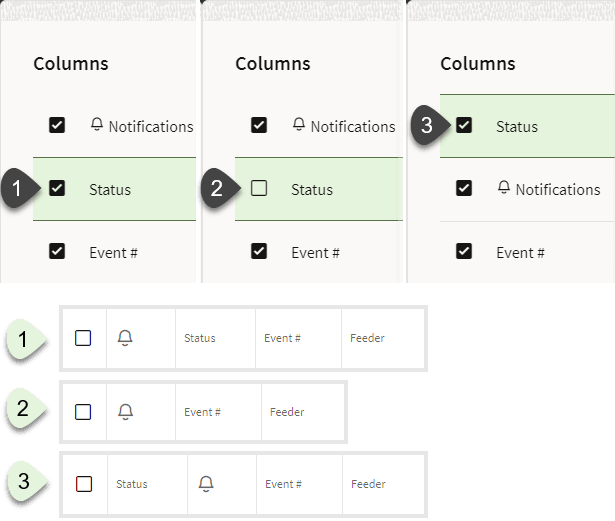
Example
The Events List table showing the Status column [1] selected and displayed, [2] deselected and hidden, and [3] displayed and moved to the left in the table.
Changing Column Widths
Move the mouse pointer over a column heading vertical separator until it changes shape, then click and drag the column to its desired width. You can also right click on any column header and choose Auto Size Column or Auto Size All Columns to let the system auto-correct column widths.
Restoring List Defaults
Right click any header and choose Restore Default Settings to revert all display changes that you have made to that list.
Using Right-Click Context Menus
In lists like Events and Crews, commonly accessed functions are available from the right‑click context menu. Switching steps can also be progressed through right-click context menus.
Revealing Additional Row Information
In many lists, double-clicking a row will display more information about the row. For example, double‑click an Events row to open its Event Details.
Understanding Table Sorting
Sorting by a Single Column
Tables may be sorted by a column by clicking the column heading or by clicking a Sort button ( ) that is displayed in a toolbar that drops down when your mouse hovers over the column heading.
Note: In addition to the Sort button, a Quick Filter button ( ) is displayed. See Understanding Quick Filters for information.
The Sort double arrow button () is available when the table is not being sorted by that column; once a column is included in a sort, the button will display the current sort direction and clicking it will reverse the sort. Sorting a column will also update the column heading cell to show the sort direction; the sort direction icon is enabled as a button when you hover over it.
) is available when the table is not being sorted by that column; once a column is included in a sort, the button will display the current sort direction and clicking it will reverse the sort. Sorting a column will also update the column heading cell to show the sort direction; the sort direction icon is enabled as a button when you hover over it.
Note: Once you sort on a different column, the previous sort column heading updates to remove the sort direction icon.