Use Analytics to Know Your Customer
Business Solution
Note:
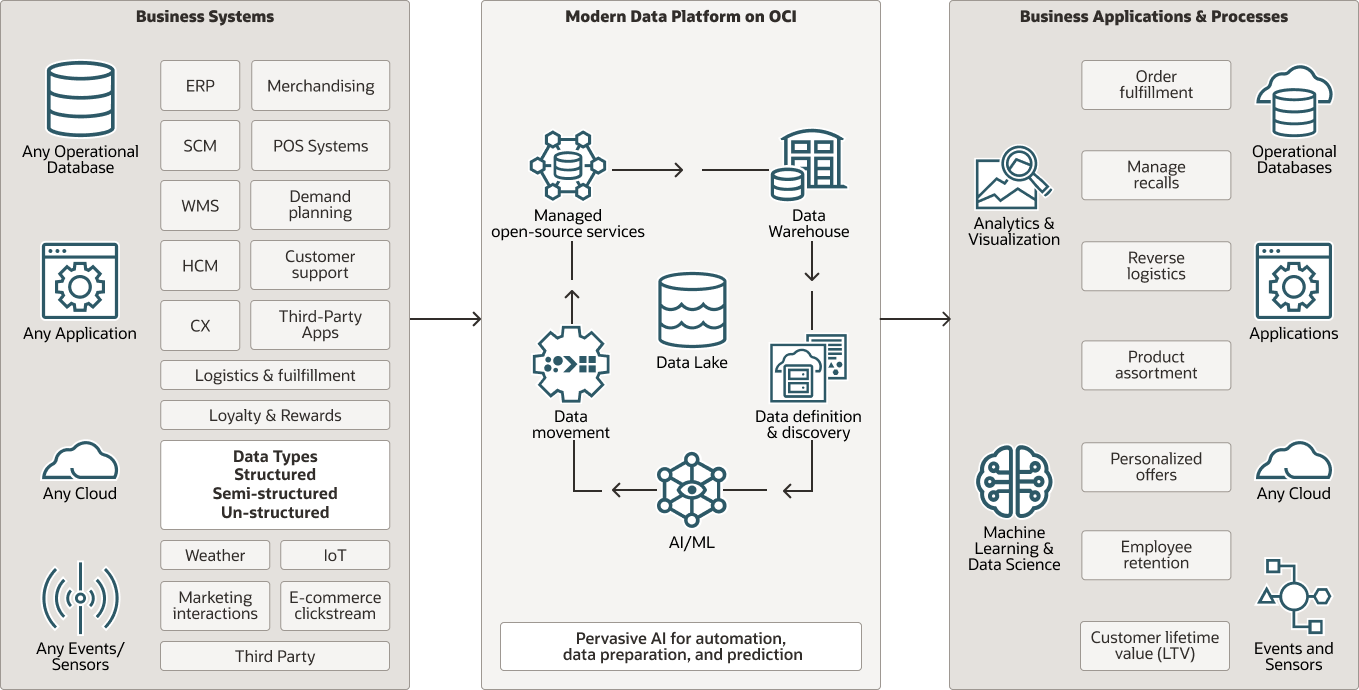
In the larger know-your-customer scenario, this would probably get additional data about campaigns, potentially merchandising, possibly social media feeds (automatically enriched and transcribed to a useful format), and other external events such as weather, sports, events, and so on.The Oracle Retail Data Platform allows you to ingest and manage all aspects of data and keep it well-organized, in one location. From structured to non-structured, from relational to videos to tweets to geospatial, all of the formats reside in one place, allowing secure and organized analysis.
- No egress fees.
- Fewer data latency and quality issues.
- One security and governance model.
Understand Relevant Industry Terms and Concepts
This playbook uses some industry terms and concepts with which you should be familiar so you can better understand the value of this scenario:
- Acquisition
Customer acquisition is the process of gaining new customers through various channels. Paid ads, social media, word-of-mouth, and email marketing are just a few examples of ways businesses can bring on new customers.
- Segmentation
A segment is a group of customers created by using data that tracks behavior and profile characteristics. Each segment has conditional criteria that qualifies certain customers from your customer database. Segments you create can be exported to other Oracle marketing orchestration tools for implementing campaigns, such as Oracle Responsys and Oracle Eloqua. As an example, your company wants to run a promotional campaign to sell excess inventory of winter apparel for children. You could create the segment for this campaign in Oracle Unity for export to a marketing orchestration tool.
- Activation
Customer activation refers to the act of motivating customers to fully realize the benefits of the product they are testing, hence increasing their overall engagement. The result could be generating a new customer or re-engaging an inactive one. Whatever it is, activation happens when a customer becomes enthusiastic about your product or service through relevant marketing by fully understanding its benefits (the elusive 'aha!' moment)
- Conversion rate
Conversion rate is the percentage of people who visit your web page that convert on your offer. Conversion rate is calculated by dividing the number of people who have converted over the number of people who have visited your page.
Technical Solution
- Weak signals from consumers (from social media).
- Customer segmentation, which allows you to drive better activation/messaging and drive merchandizing and supply strategies.
- Demand changes based on campaigns or external events (weather, sports, national events, local events).
From structured to non-structured, from relational to videos to tweets to geospatial, all of the formats are kept in one place for secure and organized analysis. While all cloud vendors have a form of data lake, Oracle’s is the only one where you can freely combine the different types of data into one toolset. You don’t need to move data between different types of databases and you can use relational tools to query non-structured data or data science tools to do machine learning in-place in the lake. What’s more, the entire data platform shares one security model, one location, and one management approach for easier and more efficient operations.
Architecture
The following diagram illustrates the workflow described in this solution.
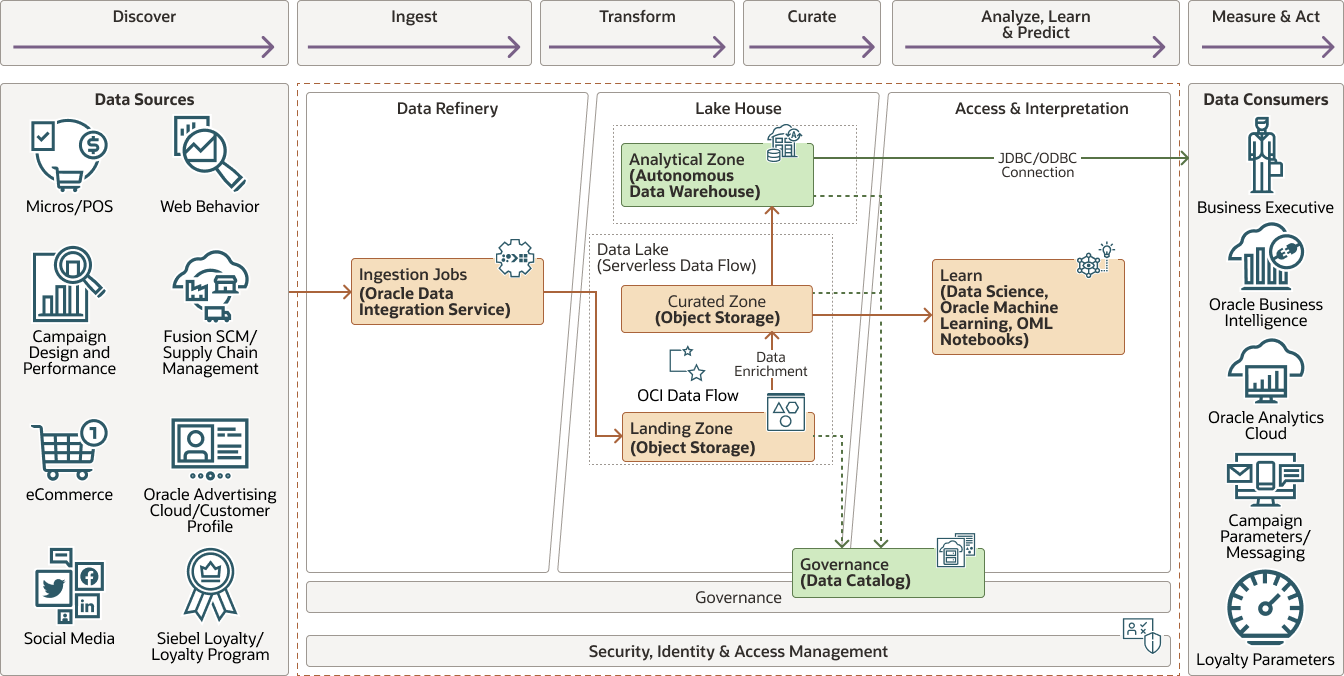
Description of the illustration retail_lakehouse_fc.png
- Discover
Here we are capturing the structured and unstructured data from different sources such as Point of Sale (POS) systems such as Micros, enterprise source systems (ERP), customer experience, product, and marketing along with IoT input, store operations, including in-store foot traffic, and social media data.
- Ingest
The data is ingested from a wide variety of source systems using OCI integration services and passed over to the data lake object storage which is the landing zone of the data platform.
- Transform and Curate
Further the data is cleansed, transformed, and enriched using the OCI Data Flow service, which is fully managed Apache Spark service, that performs processing tasks on extremely large datasets without infrastructure to deploy or manage. We move data from curated zone to the final storage layer of the data platform, which is a combination of Object Storage and Autonomous Data Warehouse (ADW). It helps democratize data across the organization.
- Analyze, Learn and Predict
The data is now used to analyze and provide business insights through centralized Oracle Analytics Cloud (OAC) dashboards. Further we extend our analysis using Oracle’s AI/ML stack to learn & predict the outcomes.
- Measure and Act
The data platform can now be integrated with custom mobile apps, open source tech stacks, hybrid platforms. In this demo, the integration with Data Science platform showcases the added intelligence to capture customer behavior.
Architecture Components
The architecture for this scenario contains these components:
- Data sources
These are the origin points for data intake to the data platform; for example, POS systems like Micros, user web behavior analytics, Fusion Supply Chain Management apps, eCommerce sources, and so on.
- Oracle Data Integration Service
OCI Data Integration is a fully managed, serverless, cloud-native service that extracts, loads, transforms, cleanses, and reshapes data from a variety of data sources into target Oracle Cloud Infrastructure services, such as Autonomous Data Warehouse and Oracle Cloud Infrastructure Object Storage.
- Object storage
Object storage provides quick access to large amounts of structured and unstructured data of any content type, including database backups, analytic data, and rich content such as images and videos. You can safely and securely store and then retrieve data directly from the internet or from within the cloud platform. You can seamlessly scale storage without experiencing any degradation in performance or service reliability. Use standard storage for "hot" storage that you need to access quickly, immediately, and frequently. Use archive storage for "cold" storage that you retain for long periods of time and seldom or rarely access.
- Data Flow
OCI Data Flow is a cloud-based, serverless platform that allows you to create, edit, and run Spark jobs at any scale without the need for clusters, an operations team, or highly specialized Spark knowledge. During runtime, Data Flow obtains the application source, creates the connection, retrieves the data, processes it, and writes the output to Oracle Cloud Infrastructure Object Storage.
- Autonomous Data Warehouse
Oracle Autonomous Data Warehouse is a self-driving, self-securing, self-repairing database service that is optimized for data warehousing workloads. You do not need to configure or manage any hardware, or install any software. Oracle Cloud Infrastructure handles creating the database, as well as backing up, patching, upgrading, and tuning the database.
- Data catalog
OCI Data Catalog is a metadata management service that helps data professionals discover data and support data governance. Designed specifically to work well with the Oracle ecosystem, it provides an inventory of assets, a business glossary, and a common metastore for data lakes.
- Data Science
OCI Data Science is a fully-managed platform for teams of data scientists to build, train, deploy, and manage machine learning models using Python and open source tools.
- Oracle Machine Learning
Machine learning is a subset of Artificial Intelligence (AI) that focuses on building systems that learn or improve performance based on the data they consume.
- OML Notebooks
Oracle Machine Learning Notebooks is a collaborative user interface for data scientists and business/data analysts who perform machine learning in Oracle Autonomous Database.
- OCI Language
OCI Language is a cloud-based AI service that performs sophisticated text analysis at scale. This service helps you build intelligent applications by leveraging REST APIs and SDKs to process unstructured text for sentiment analysis, entity recognition, translation, and more.
- Oracle Analytics Cloud
Oracle Analytics Cloud is a scalable and secure public cloud service that empowers business analysts with modern, AI-powered, self-service analytics capabilities for data preparation, visualization, enterprise reporting, augmented analysis, and natural language processing and generation. With Oracle Analytics Cloud, you also get flexible service management capabilities, including fast setup, easy scaling and patching, and automated lifecycle management.
- Data Consumers
Data consumers are entities that visualize and use data processed by the data platform. This might include business executives, Oracle Business Intelligence apps, Oracle Analytics Cloud, or a customer's campaigns, messaging, and loyalty programs.
Dashboards
- Executive Dashboard
- Customer Profiling Dashboard
The examples in this playbook focus on these dashboards and how the retailer can gain insights from them. You can also combine the metrics you gather from these dashboards with a loyalty program management application, such as Oracle's CrowdTwist, to better understand and address customer behavior. These applications typically provide such features as registration, points tracking, offers and reward redemption. A loyalty program application like CrowdTwist would be used as a source and possibly a consumer of the analytics shown in this scenario.
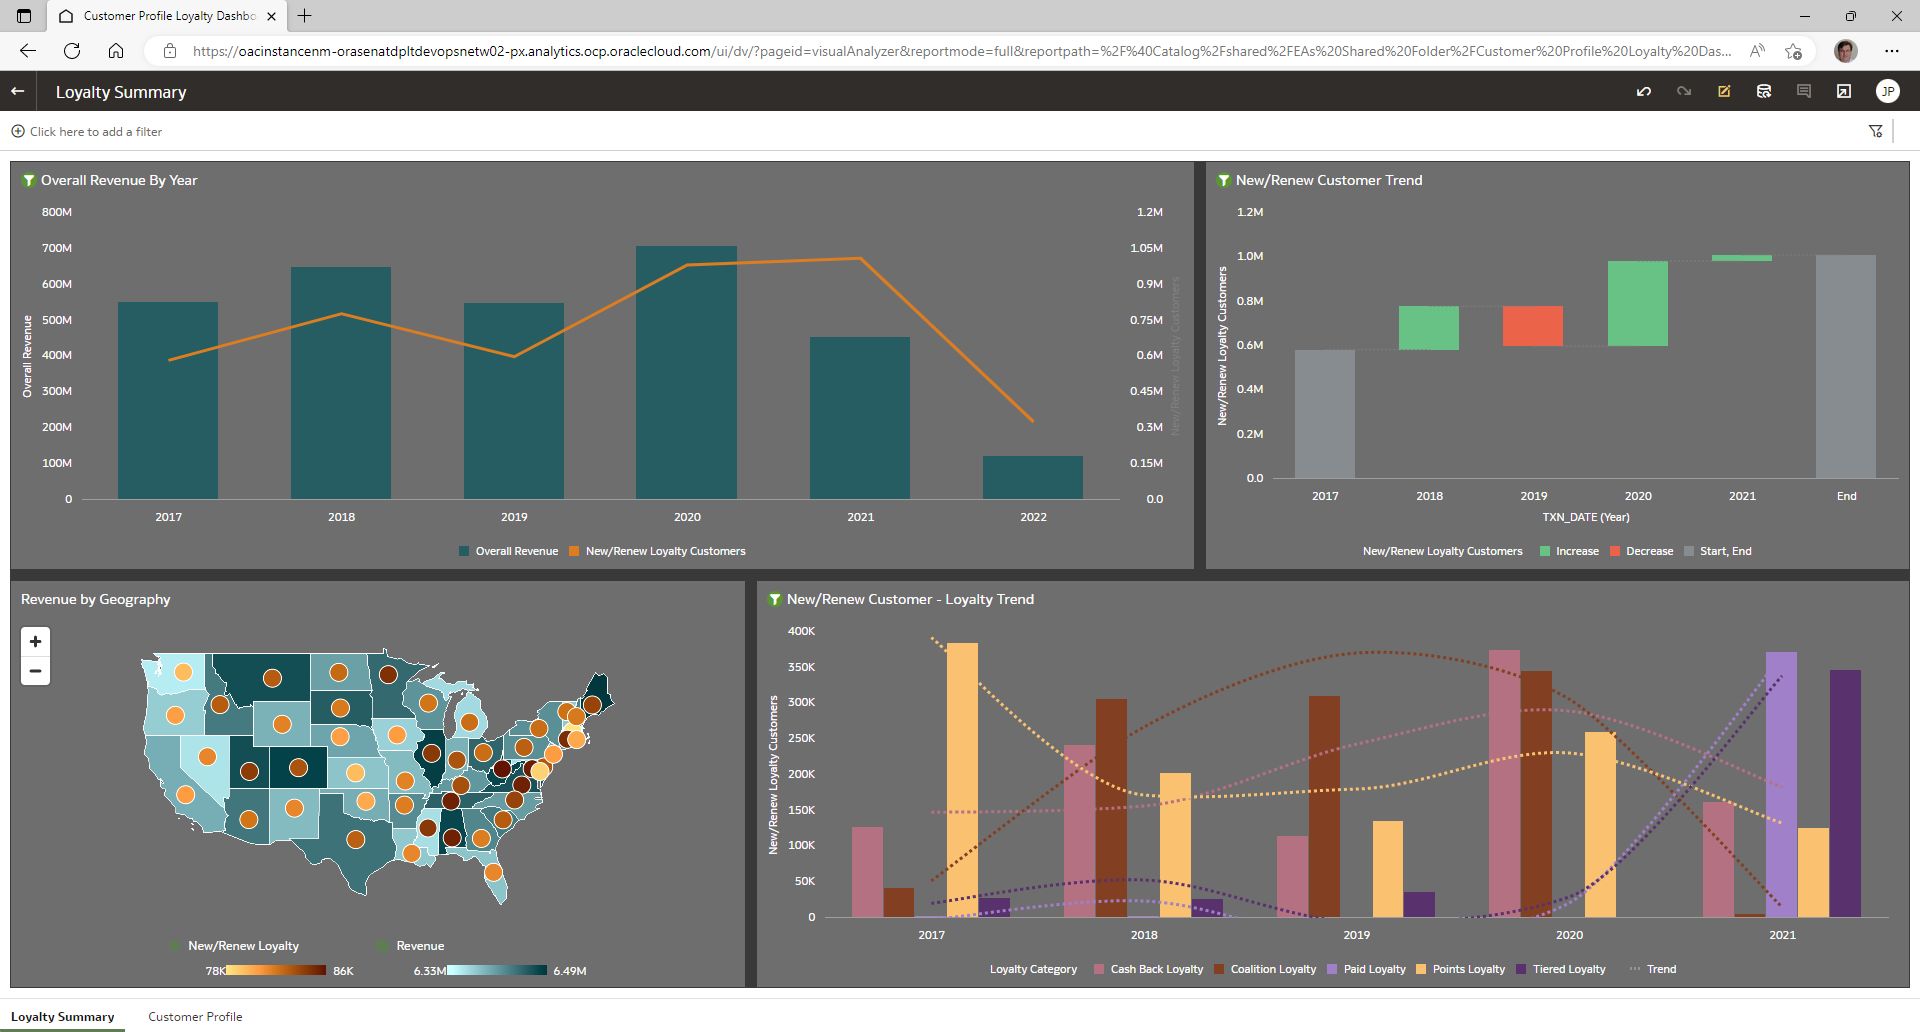
The various perspectives available on the loyalty program dashboard showcase the loyalty program performance and conversion rates across United States. It analyzes the membership movement for the past couple of years along with identifying the reasons for business deviations. The customer profiling perspectives show different aspects of customer identification and behavior, such as memberships, conversion rate (per store traffic), geo presence of program, decline reasons, points redemption, and management campaigns.
Although these look like simple graphs of clean data, this data is rarely available in a simple format in a single place. While the business users mainly see the outcome, the actual process for getting here is complex and in the past, most organizations have been able to do this as primarily manual process maybe once or twice a year. Our solution enables you to analyze all this and more on an on-going basis. To make the most sense, instead of relying on static classifications, we are letting AI find several of the categories and help with the modeling.
Be aware that not all of this data was available in-house. Some of the items—specifically age and marital status—are data enrichment from external source, Oracle Advertising Cloud.
Store Traffic Conversion Rate
The example below tells this story: the first chart shows the overall loyalty membership against the quarterly conversion rate (that is, new Loyalty members). In the quarter-to-quarter comparison, you can see a downward trend in the loyalty conversion rates starting Q3 2021. Now, do a deep dive into the other bar graph. It shows the store traffic has increased significantly (~100% growth) in 2021 but the net new transactions are around 25%. So, it seems that, since 2021, something has gone wrong with loyalty programs.
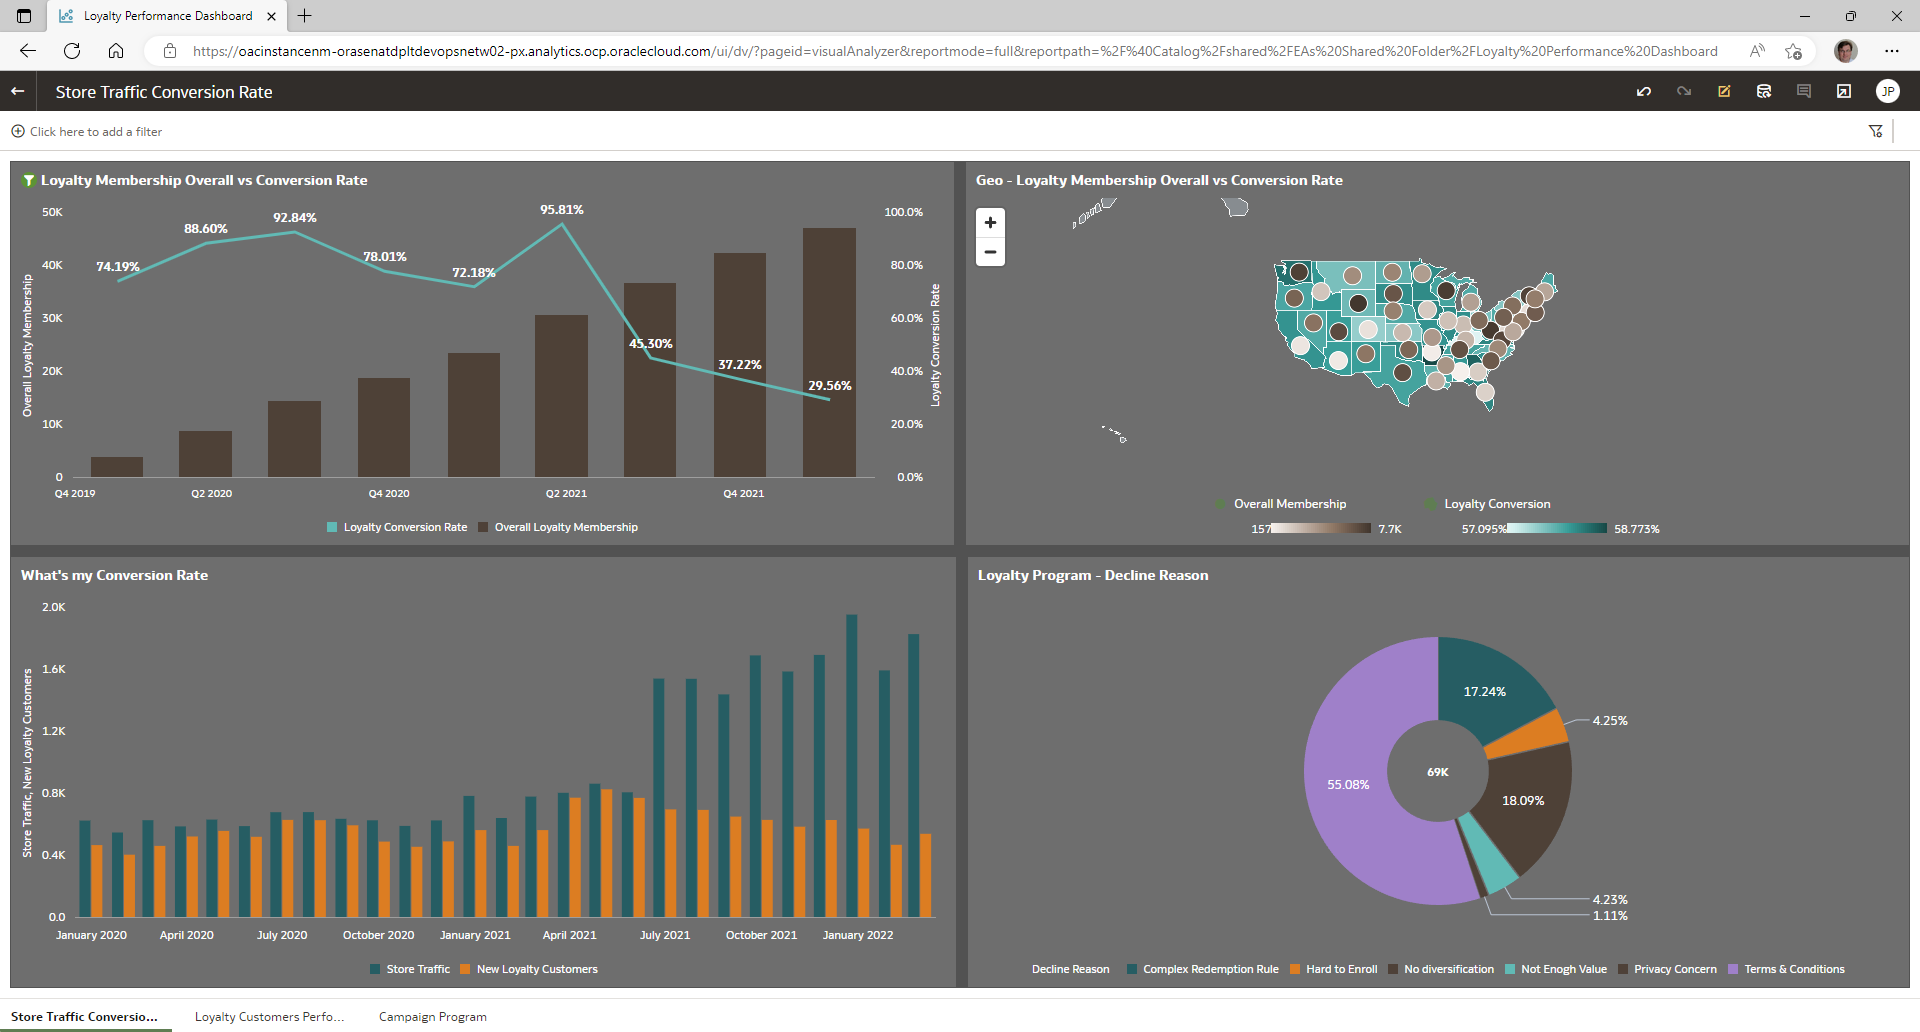
Description of the illustration store_traffic_conversion.png
Loyalty Customer Performance
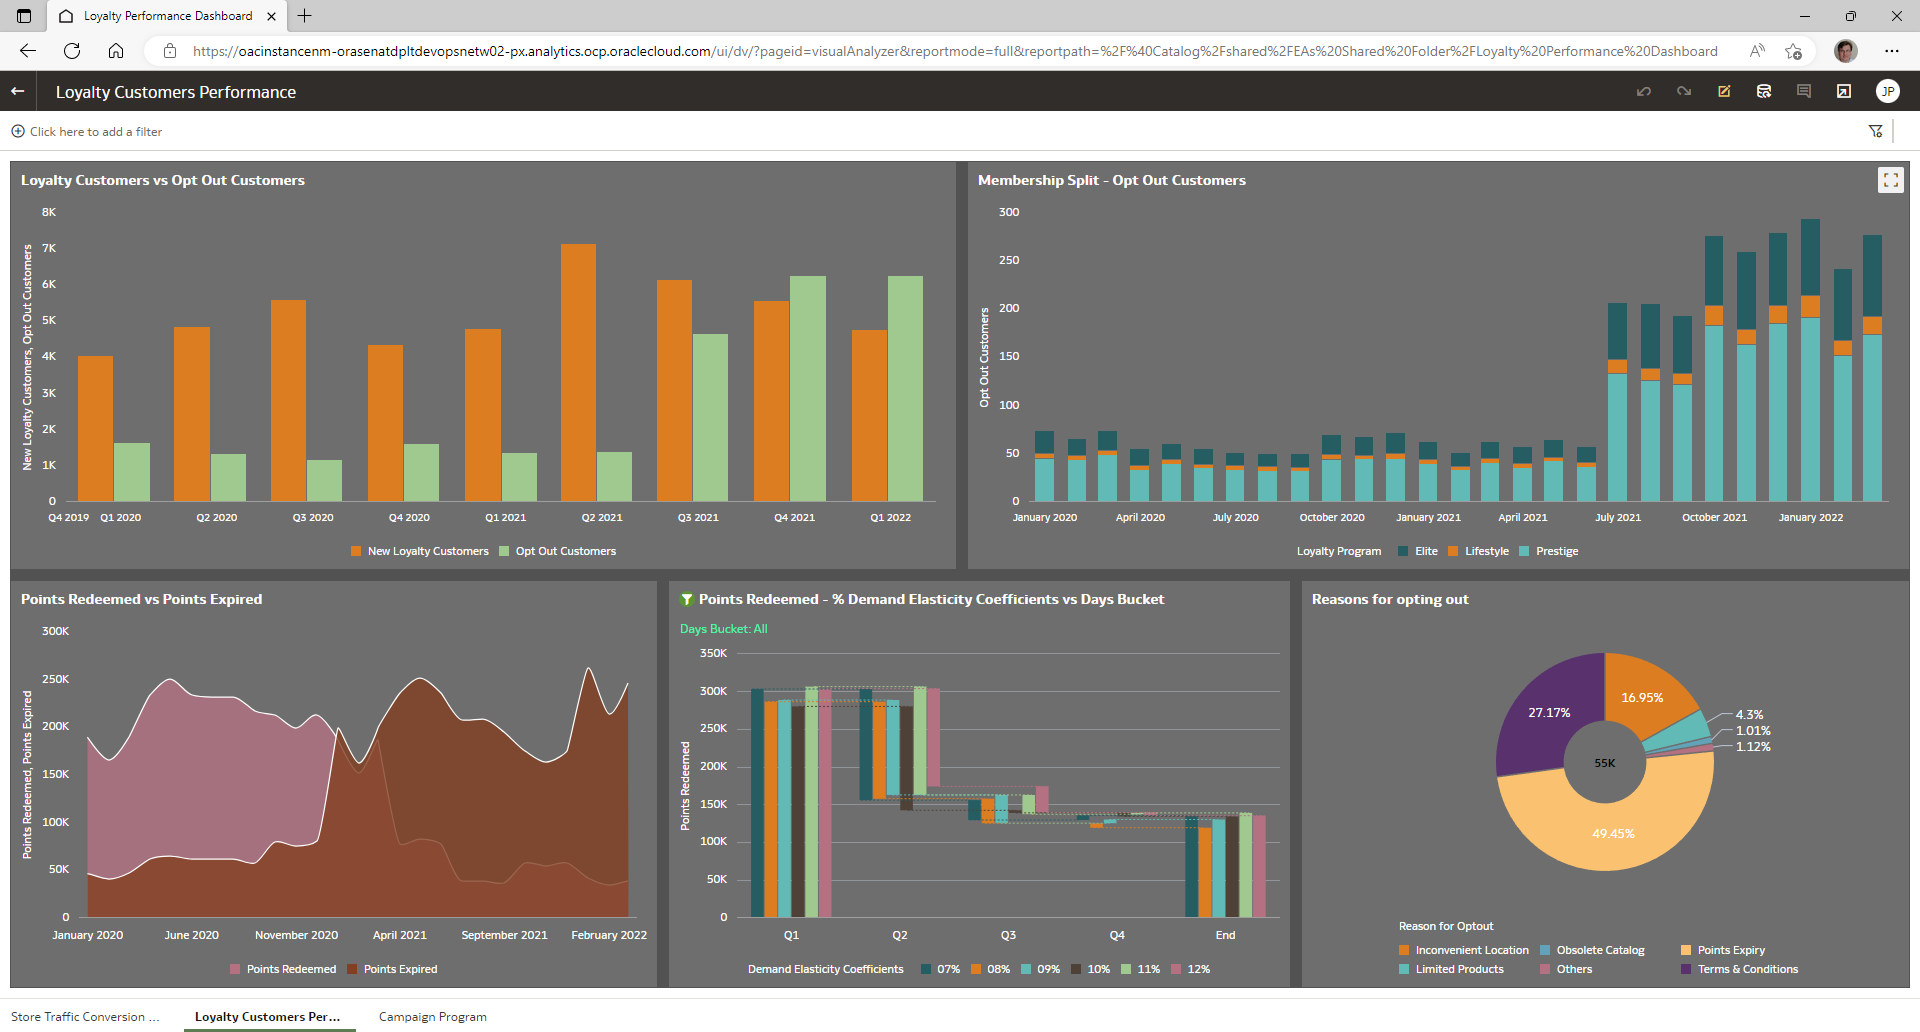
Description of the illustration loyalty_customers_performance.png
In this example, if you examine the preceding ten quarters, the first two bar charts indicate a significant loyalty program iteration/opt-out in the customer membership from Q3 2021 onward. Focusing on the lower half of the dashboard, you see the behavior of points redeemed vs. points expired indicates a decrease in points redeemed and a corresponding increase in points expiring. From this, you might conclude that customers are not able to redeem points by the given reward expiration date. The pie chart (lower right) indicates that about 50% of customers mentioned point expiration as the key reason for opting out from the loyalty program. Based on this data, your actionable insights might indicate that you examine the points allotment and expiration timeline in detail.
Campaign Program
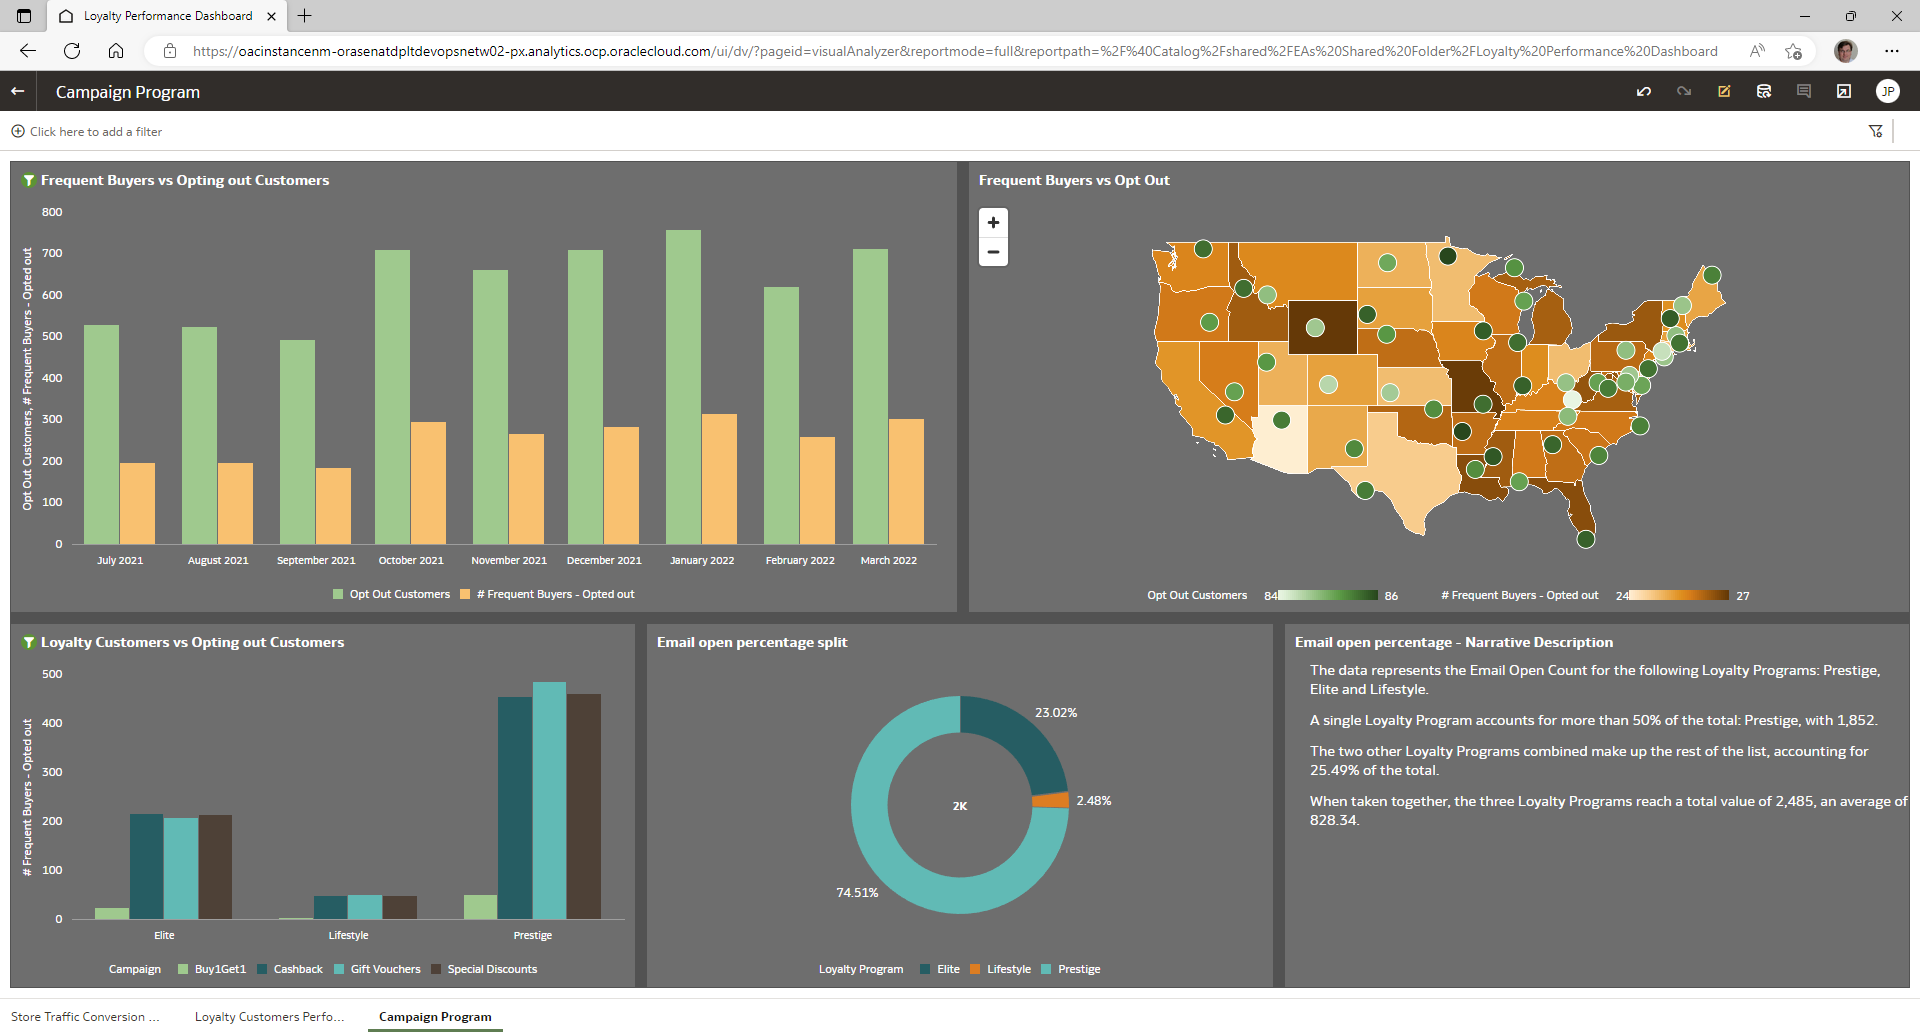
Description of the illustration campaign_program.png
- Cashback offers
- Buy One, Get One (BOGO)
- Gift vouchers
- Special discounts
Loyalty Summary Dashboard
Use the Loyalty Summary Customer Profiling dashboard to compare revenue to how effective you are onboarding new loyalty subscribers.
In this scenario, using data for the past five years, you can see that revenue has been declining since 2021. As recently as March 2022, revenue is still not that great but, by analyzing the waterfall graph, you see, surprisingly, an upward trend in acquiring new loyalty members.
Now, focus on the bottom bar graph and evaluate new/renewal activity for loyalty customers. You'll notice that up to 2020, your loyalty program mainly focused on cashback offers and coalition loyalty but, since 2021, part of our business strategy shifted focus to the Paid and Tiered loyalty program. Based on this data, actionable insights indicate the need to reexamine your business strategy to determine how you can return focus to Cashback and Coalition programs.
Customer Profile
The Customer Profile dashboard is another perspective on customer behavior based on demographic metrics compared to revenue.
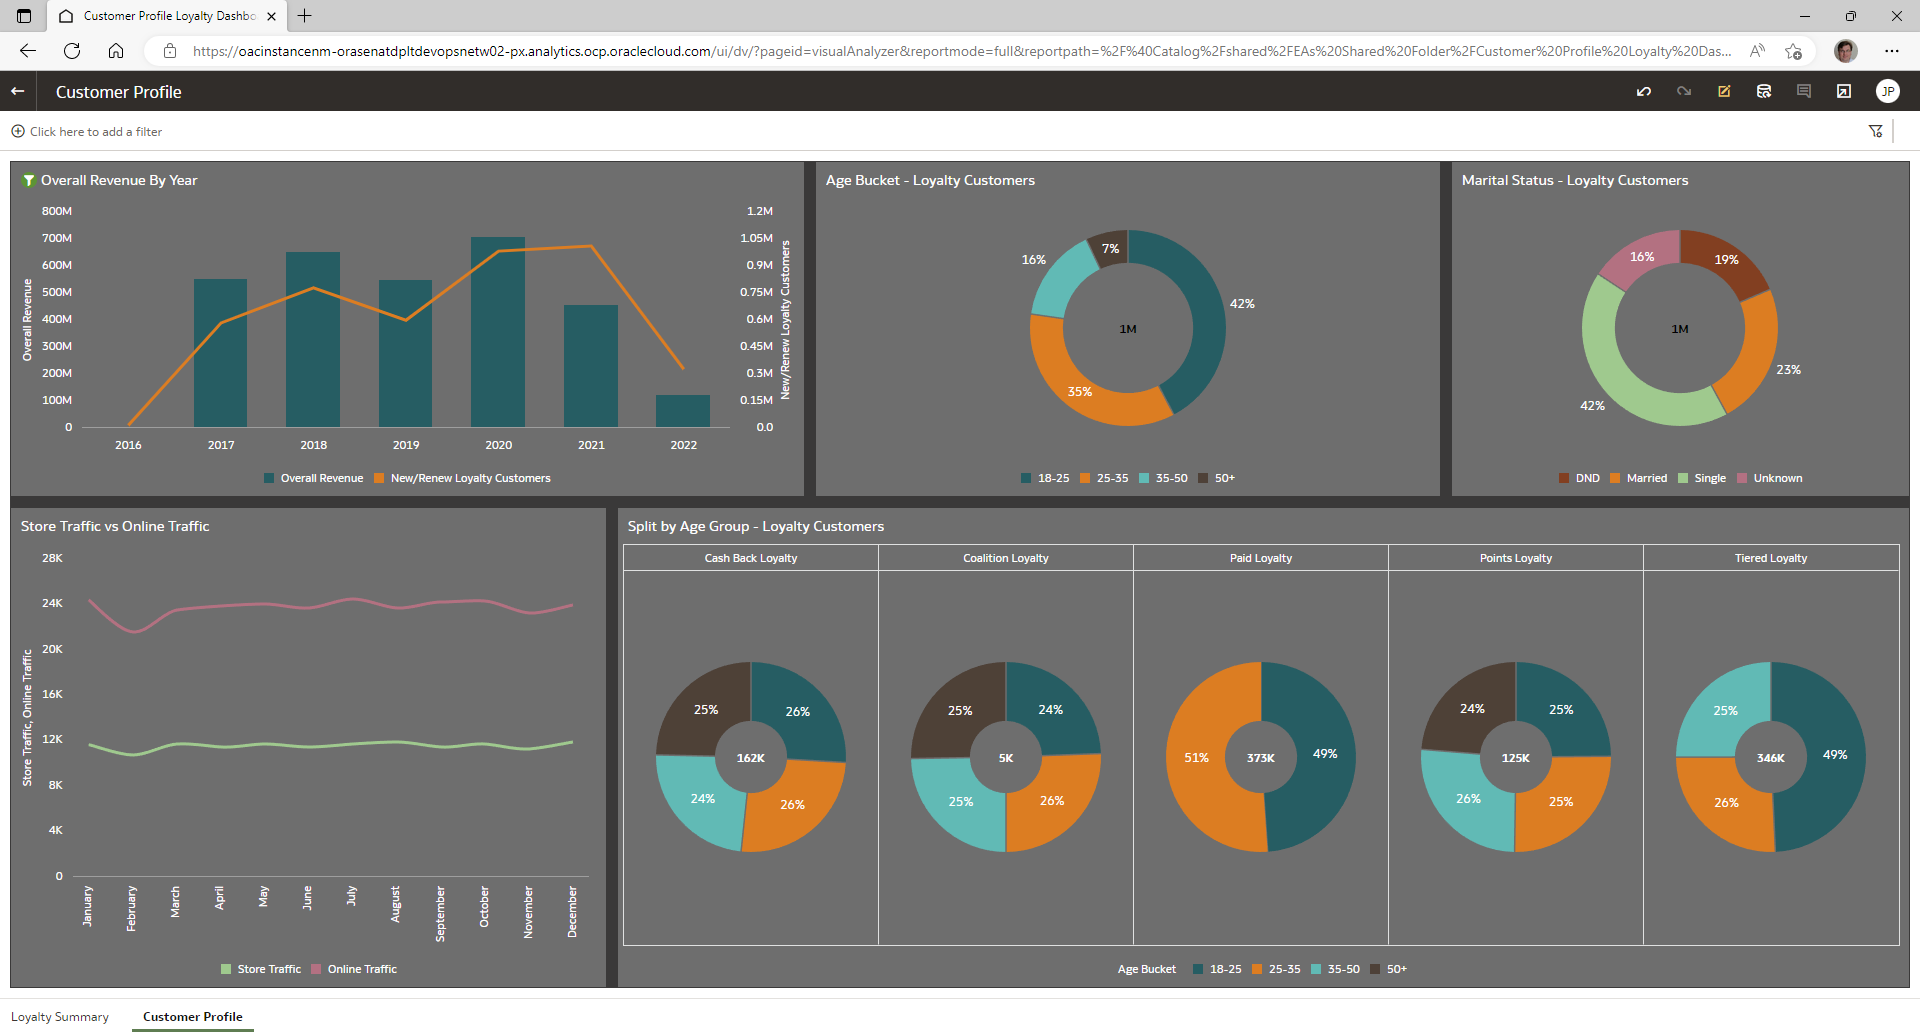
Description of the illustration customer_profile.png
In this scenario, you can see that business revenues have slumped since 2021. To identify the reason behind the drop in sales, this dashboard allows you to examine different aspects such as memberships, geo presence, loyalty program category, marital status, age, and purchase pattern. Then, once you've determined that you want to change the redemption rules, you can use visualizations provided by this dashboard to try out different parameters and see how they would impact your loyalty success. For example, if you look at year 2020, the loyalty programs were mainly designed looking at the married people, who contribute to 51% of the entire customer base and different loyalty programs—such as coalition and cashback along with the tiered loyalty—that were providing deep major contributions of 25 to 35 age group. Therefore, you need to look at how you can roll out lucrative offers to bring back the married customers in 25-35 age group. So, to obtain actionable insights, you could perform what-if analysis and based on the redemption rules, you can try out different parameters to visualize how it would impact your loyalty success.
