Exploring Memory Usage
The Memory Usage indicator shows how your project's memory heap changes over its runtime. You can use it to identify memory leaks, which are points in your program where memory that is no longer needed fails to be released. Memory leaks can lead to increased memory consumption in your program. If a program with a memory leak runs long enough, it can eventually run out of usable memory.
-
Slide the time slider in the Run Monitor to the left and right to see how the memory heap increases and decreases over time. There should be four spikes that occur in ProfilingDemo_1. The first two occur during the Sequential Demo, the third occurs during the Parallel Demo, and the last occurs during the Pthread Mutex Demo.
-
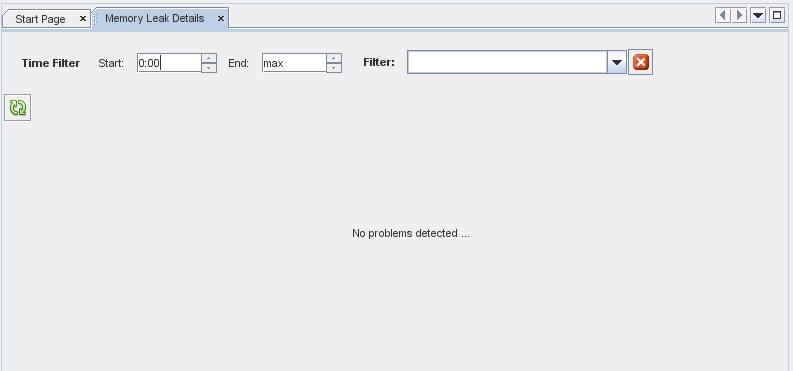
Click the Memory Leaks button to display the Memory Leak Details window. This shows details about which functions exhibit memory leaks. Only functions that are producing memory leaks are listed in the table. If your program is running when you click the button, the leak locations shown are those that exist at the moment you clicked the button. More leaks may occur as time goes on, so you should click the Refresh button. If no memory leaks are detected by the end of the run, the Memory Leak Details tab indicates that no memory leaks were found.
-
You can change the Start and End times to filter the data, or use the orange colored details slider in the Run Monitor window, same as in the Exploring CPU Usage section. There are no memory leaks in this example.

-
Double-click a function and the corresponding file opens at the line where the memory leak occurs in the function. The memory leak metrics are displayed in the left margin in the source editor.
-
Mouse over them to display the details as we did with the CPU Usage metrics.
-
Right-click the metrics in the table to filter the data in the table. This data filtering in the table is possible with all the profiling tools.