Understanding the Java HotSpot Compiler Behavior
This procedure continues from the previous section, and shows you how to use the Timeline and Threads views to filter and find the threads responsible for HotSpot compiling.
-
Select the Timeline view and remove the filter by clicking the X in the Active Filters panel
-
Reset the zoom levels by doing one of the following:
-
Right-click in the Timeline and select Zoom → Reset Time Zoom
-
Click the |< button to the left of the horizontal slider in the Timeline tool bar
-
Press zero (0) on your keyboard.
-
-
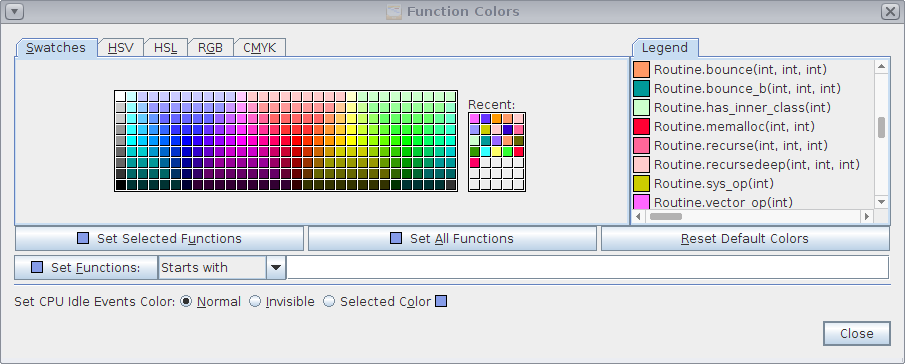
Open the Function Colors dialog again, and pick different colors for each of the Routine.* functions.
In the Timeline view, the color changes appear in call stacks of thread 2.

-
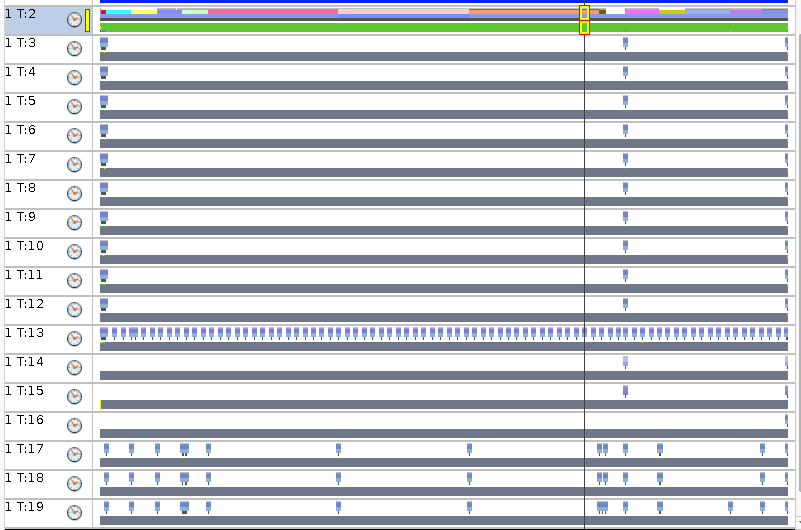
Look at all the threads of the Timeline in the period of time where you see the color changes in thread 2.
You should see that there are some threads with patterns of events occurring at just about the same time as the color changes in thread 2. In this example, they are threads 17, 18, and 19.

-
Press Ctrl and multi-select the main thread (T:2 in this example) and the rows in your experiment that show a pattern similar to T:17 - T:19 in this example.
-
Right-click on the timeline view and select the filter Include Only Selected Rows.
Alternatively, click the filter button
 in the toolbar and select the filter.
 -
Adjust the horizontal zoom to make the pattern easier to see.
-
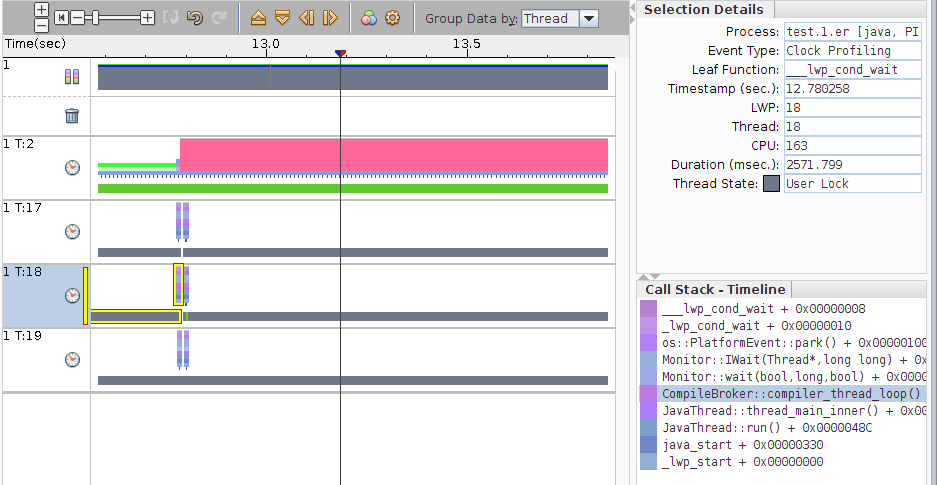
Click on events in threads 17 and 18.
Note that the Call Stack panel shows CompileBroker::compiler_thread_loop(). Those threads are the threads used for the HotSpot compiler.

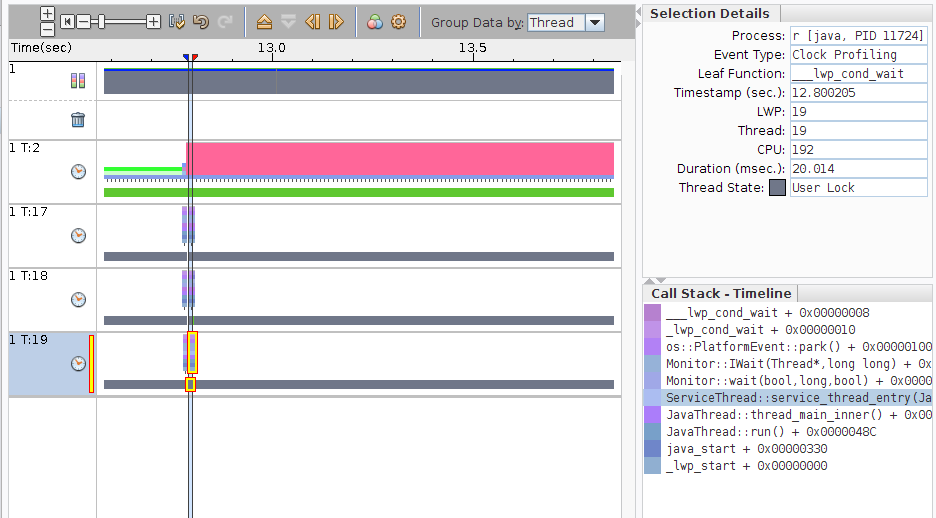
Thread 19 shows call stacks with ServiceThread::service_thread_entry() in them.

The reason the multiple events occur on those threads is that whenever the user code invokes a new method and spends a fair amount of time in it, the HotSpot compiler is triggered to generate machine code for that method. The HotSpot compiler is fast enough that the threads that run it do not consume very much User CPU Time.
The details of exactly how the HotSpot compiler is triggered is beyond the scope of this tutorial.