Chapter 18 |
Sun Management Center Web Interface |
Note - This feature may or may not be available on your system, depending on your licensing agreement.
This chapter covers the following topics:
The Sun Management Center Web Interface is a web-based management interface for the Sun Management Center platform. It is a host management system that uses HTTP protocol to provide easy access to Sun Management Center management information. Sun Management Center users can access the Web Interface across the firewall to monitor and manage Sun Management Center information from any location using widely-available web browers, such as Netscape Navigator and Internet Explorer.
The Sun Management Center Web Interface provides most of functions of the Sun Management Center Java Console for host management. It allows users to monitor and manage alarms and modules, and rapidly navigate the managed objects.
TABLE 18-1 lists the functions that are provided by the Web Interface and the chapters in which the corresponding Java-based functions are described. This chapter describes the Web-based functions and use.
The Sun Management Center Web Interface is an optional Sun Management Center component. It depends on the Sun Management Center Server for retrieving and manipulating managed objects.
 |
To Start the Sun Management Center Web Interface |
| 1. | Start your web browser. |
Note - You do not have to be superuser to run the Sun Management Center from your web browser.
| 2. | Enter the Sun Management Center web location URL:
|
| 3. | The Sun Management Center Login page (FIGURE 18-1) is displayed. |
| This Login Page is for entering your user ID and password. The Sun Management Center server and web server are on the same host. |

| 4. | Log in using a valid UNIX account. |
| This account must be listed in the /var/opt/SUNWsymon/cfg/esusers file on the Sun Management Center server. |
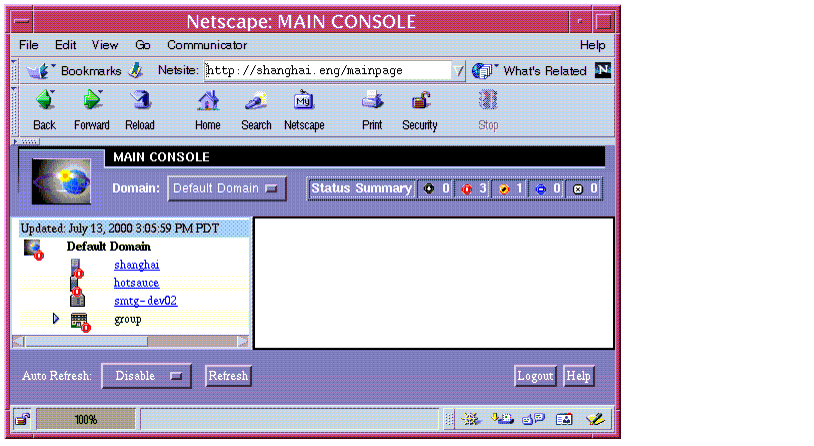
| After you log in successfully, the Main Console (FIGURE 18-2) is displayed. |
All available domains are displayed in a drop-down Domain options menu. You can select one domain at a time to monitor or manage objects that are under the selected domain.
When you select a domain (FIGURE 18-2), the object hierarchy tree is displayed. Each tree node represents a topology object. If the there are child objects under the node, the tree node can expand or collapse. All tree nodes are displayed along with their associated icons, such as topology type icon, alarm icon, and expandable (or collapsible) icons for group objects.
A domain alarm state status icon for the selected domain is displayed next to the domain icon. A time stamp display above the domain name shows when the current page was loaded from the server.
Selecting a domain splits the page in two. The contents view (right side) of the screen displays the details about the selected host, including the state of the machine and a time stamp. A hyper-link enables you to display the Host Details page, which provides additional object/module monitoring information and management capabilities. Only host objects can be selected.
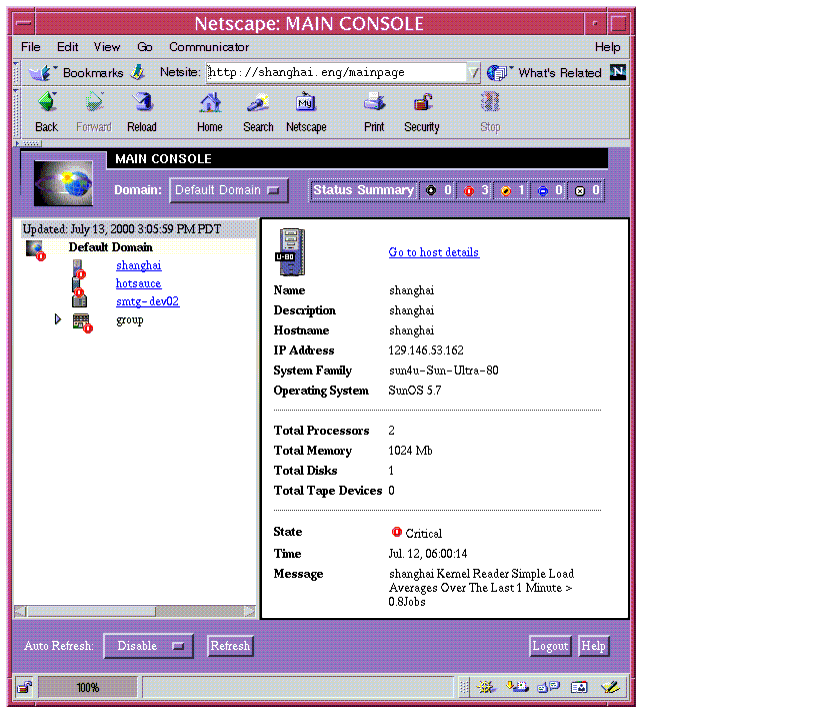
FIGURE 18-3 Main Console, Example Host (Shanghai) in Default Domain Selected
TABLE 18-2 lists the Main Console and Host Details buttons and describes their functions.
Clicking the web browser Reload button reloads the entire page, including all frames.
TABLE 18-2 Main Console and Host Details Buttons Button
Function
Auto Refresh
Disables and enables the auto refresh feature. The Auto Refresh enable menu contains:
Automatically refreshes the display according to the item selected. These options can be configured on the server through a configuration file.
Refresh
Refreshes the screen display immediately.
Main Page
Redisplays the Main Page.
Logout
Enables users to close the Sun Management Center. After logging out, the Login page (FIGURE 18-1) is displayed.
Help
Displays the online help for this panel in another browser window.
| |
To Display the Host Details Browser Page |
| 1. | Select a domain from the Domain menu, for example Default Domain |
| 2. | Click on a leaf (host) tree node, for example, shanghai. |
| 3. | Click on "Go to host details." |
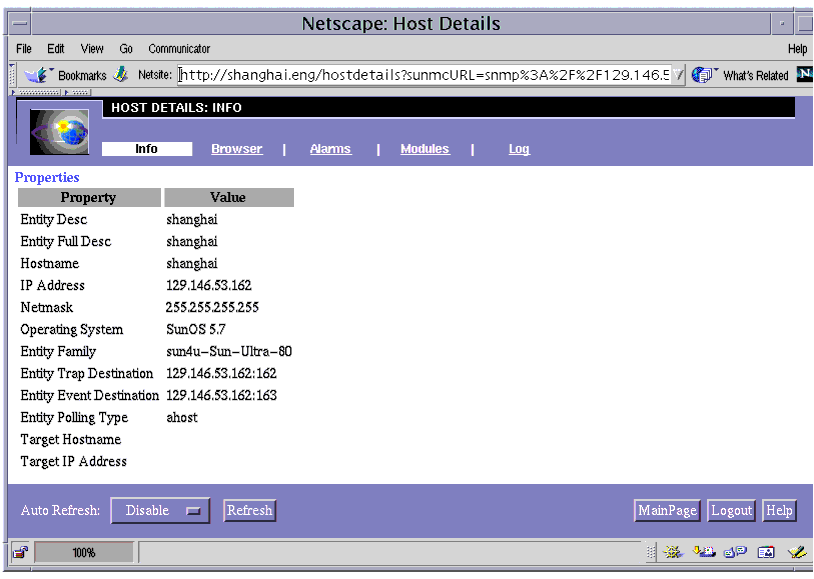
| The Host Details Browser page (FIGURE 18-5) is displayed, replacing the Main Console page. |
At the top of the Host Details page, some or all of the of the following tabs are displayed, depending on the type of host: Info, Browser, Alarms, Modules and View Log. These tabs have the same basic functions as the Details window described in Chapter 6.
The Info page displays the general information about the object. This window is the same as the Details Info tab window described in Chapter 6.
When the Browser tab is selected, the center of the page splits into two vertical frames (FIGURE 18-5) in the same manner as the Browser Window described in Chapter 6, and functions similarly.
This window has Auto Refresh, Refresh, Main Page, Logout and Help buttons, which are described in TABLE 18-2.
For additional details, see Chapter 6.


FIGURE 18-6 Host Details Browser Page with Module Properties Table
The Web Interface Alarms Manager is almost identical to the Sun Management Center 3.0 Alarms Manager described in Chapter 12. For Web Interface Alarm Manager details, see Chapter 19. When Auto refresh is enabled, all operation buttons and the selection column (column one) are disabled.

The Alarms page is similar to the Sun Management Center 3.0 Alarms Details window. Auto Refresh Disable enables all of the operation buttons, except the Filter button, and disables the selection column (column one).
View Alarms in the Options menu enables you to filter the alarms table by severity, open or closed alarms, and/or acknowledged or unacknowledged alarms. FIGURE 18-8 shows the View Specific Alarms dialog. For details, see Chapter 19.

| |
To Filter the Alarms Table |
| 1. | Click the box(es) next to the item(s) to select (or deselect) the item. |
| A check mark is displayed in each box you select. |
| 2. | Click OK to accept the changes and close the dialog. |
The alarms table is filtered and redisplayed to reflect your selections.
The Modules page displays all available modules and their status (that is, whether they loaded or unloaded, and for the loaded modules, whether they are enabled or disabled). Modules can be loaded, unloaded, enabled, and disabled by an authorized user only.

Note - To load or unload and enable or disable a module you must have the appropriate security permission. For more information, see Chapter 14.
The Host Details Modules page is similar to the Module Loader window described in Chapter 6. In some cases editing can be done on the Host Details Modules Page. TABLE 18-3 lists the Host Details Modules page hyperlinks.
TABLE 18-3 Host Details Modules Page Hyperlinks Action
Function
Load
Loads the selected module. This action displays the Module Loader dialog (FIGURE 18-10).
Unload
Unloads the selected module.
Enabled
Enables module.
Disabled
Disables module.
This window also has Auto Refresh, Refresh, Main Page, Logout and Help buttons, which are described in TABLE 18-2.
The Module Loader dialog enables you to Load any of the modules listed in the Modules Available for Loading table on the Host Details Modules page.

This page also enables you to schedule the modules.
| |
To Display the Module Loader Dialog |
| 1. | Click the Load link in the Action column of the Modules Available for Loading table for the module you want to load. |
| The Module Loader dialog is displayed. |
| 2. | Click OK to load the selected module. |
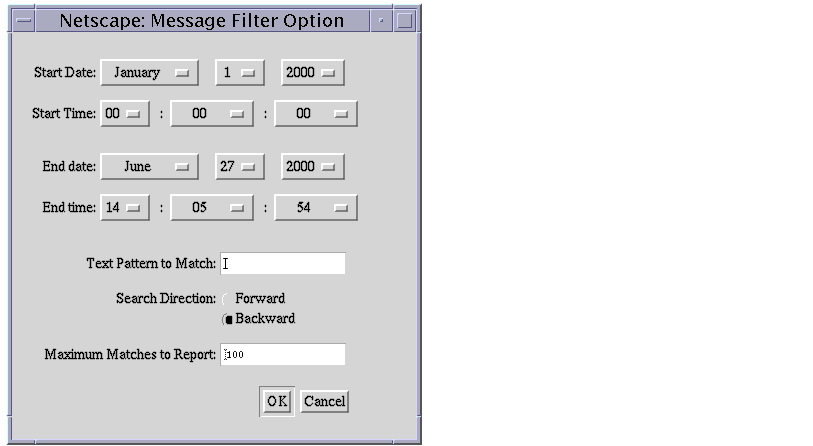
The Log tab displays system log information. It has an option menu for log file types and a text area for log file content. The filtered messages are displayed. The Log tab page also has a Filtered Messages dialog that enables you to filter the messages displayed in the text area by Starting and Ending date and time, and so on.

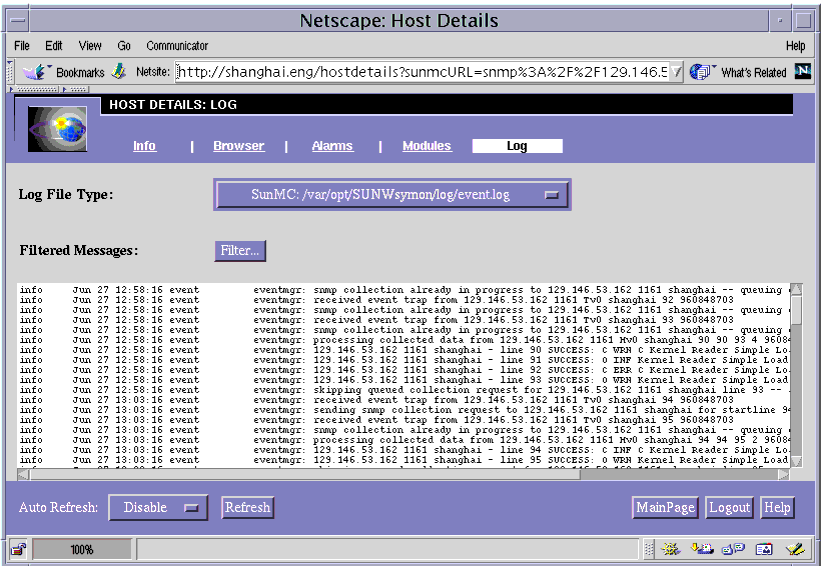
FIGURE 18-13 shows the Message Filter Option dialog.
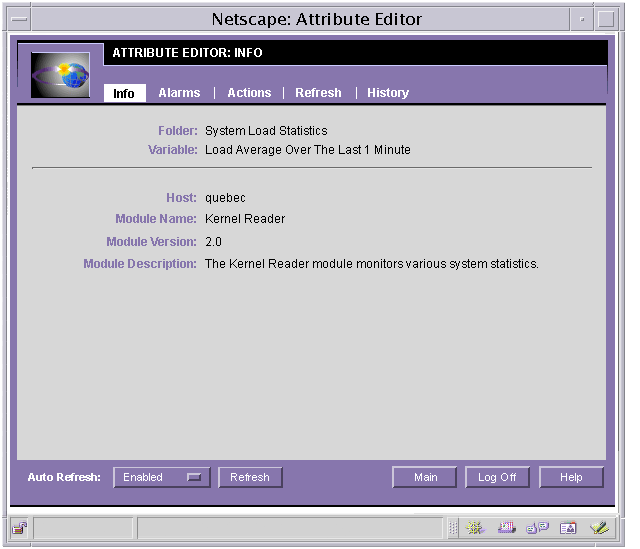
| The Attribute Editor is displayed after a property value is selected in a properties table. Selecting one of the property values displays the Attribute Editor Info page in another browser window, which allows you to do limited editing for the property. If there is no value, a "__" is displayed for the hyperlink |
| The Attribute Editor has some or all of the following tabs: Info, Alarms, Actions, Refresh and History. This Attribute Editor, is similar to the Java-based Attribute Editor, which is described in Chapter 9. |
Advanced editing, such as time editing, is not provided in this release. Otherwise, the Attribute Editor functions the same as described in Chapter 20.
| 1. | Log in as UNIX root account and stop the Web Console by using the es-stop -w command.
|
| 2. | Change current path to /opt/SUNWsymon/netscape/https-admserv, and start the Netscape fasttrack admin server.
|
| 3. | Bring up the Web Browser and enter http://[machine]:8888 in the URL text field. |
| 4. | Log in as admin (account name and password both are "admin"). |
| 5. | Select localhost from the Server Option menu and click the manage button to go to the localhost Server Manager page. |
| 6. | Click the Security tab, and select Create Database. |
| 7. | Enter the password in the Database Password field and click OK to create a Trust Database. |
| 8. | After you have successfully created a Trust Database, click the Request a Certificate tab and follow the instructions to request a certificate from the CA (Certification Authority). |
| 9. | Click on the Install Certificate tab to install the certificate from the CA. |
| 10. | Switch back to the Preference tab, click the Encryption tab, and turn on Encryption. |
| 11. | Click the On/Off tab to turn on your Web Server. |
| You can now access the Sun Management Web Console through a secure http connection. The URL for the Sun Management Web Console starts with https://. |
For more detailed information about web server administration, refer to the FastTrack Online Help.
Note - The Web Console runs under your Web Browser. Thus, you can change the font size. If you select a very large font, some pop-up windows may be too small to display all contents correctly. You can enlarge the windows to display them properly. All pop-up windows sizes are based on a 12-pixel font, so we suggest using this size font for the Web Console.