The metadata model is a business presentation of the information provided by the ATG data warehouse. The model is used by business users and report creators, rather than working directly with the database.
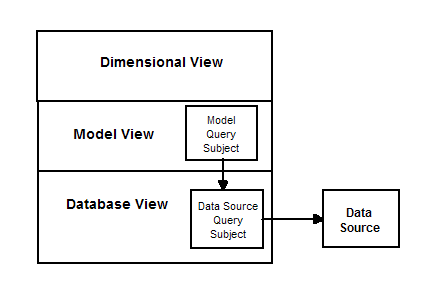
There are three layers (views) to the metadata model, representing increasing levels of abstraction of the underlying report data:
Database View. Directly represents the data as it appears in the ATG data warehouse. The database is queried by Data Source Query Subjects, which map directly to SQL queries on your database. In the user interface, lines that link data source query subjects show relationships and cardinality between query subjects.
Model View. A more abstract way of interacting with the data, the model view uses Model Query Subjects to combine Data Source Query Subjects into informational chunks more easily accessible to a business user.
Dimensional View. An abstraction layer providing the highest-level view of reporting data, targeted at business users.
Data Source and Model Query Subjects contain query items, which can be used for to retrieve any of the following item types:
ID. The item is an identifier. Identifiers are usually not of interest to reports. Most ID fields have ID in the name of the database field.
Fact. Metric, measure, indicator, or other (usually numeric) data that can be aggregated, and is the focus of reporting. Sales numbers or manufactured units are examples of facts.
Attribute. Provides the context in which facts can be usefully viewed, such as time or location.
Reports are composed of combinations of facts and attributes, for example: sales (fact) per month (month is an attribute of the Time dimension).
The dimensional view is most important to report users. This view shows metrics in terms of their attributes. It includes the following entities:
Measure dimensions - Facts, counts, numeric data, the things you are trying to measure, aggregate, and report on.
Regular dimensions - Facts in context of their attributes. For example, $3 million is a fact; $3 million in revenue for widget foo in 2003 is a fact with two dimensions, product and time. Regular dimensions define the ways in which measure dimensions can be organized.
Scope relationships - Relate the measure and the regular dimensions. See dimensional map in the UI.
Another important concept is that of a hierarchy. Hierarchies allow you to roll up or aggregate information in different levels and then navigate it easily. Dimensions can be composed of multiple hierarchies (always at least one), which tell you how things roll up. A classic example is time; if you have year, quarter, month, day, hour, you can define two hierarchies:
year > month > day > hour
year > quarter > month > day > hour
Each item is a level in the hierarchy. Levels also contain attributes. In your reports, you can now provide two possible levels at which the end-user can explore data.
For more information on metadata modeling, see the Framework Manager User Guide.
