The report output includes several sections.
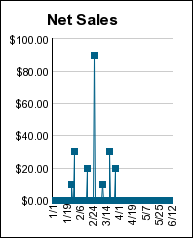
Net Sales—Line graph provides the net sales for each day.
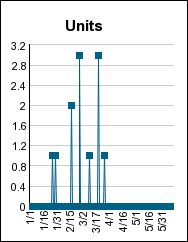
Units—Line graph provides the unit sales for each day.
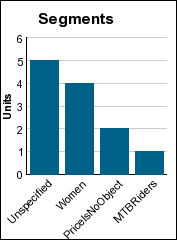
Segments—Bar chart provides unit sales by segment.
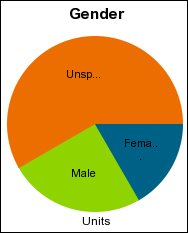
Gender—Pie chart provides the unit sales by gender.
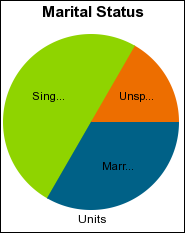
Marital Status—Pie chart provides the unit sales by marital status.
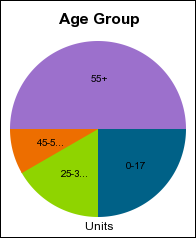
Age Group—Pie chart provides the unit sales by age group.
Summary—The Summary table details sales data for the product during the last 14 days. It includes the following information:
Sku Name—The product Sku ID.
Net Sales—The Net Sales for the reported time period.
% Net Sales—The percentage of total net sales that are represented by the net sales of this product.
Units—The number of items sold for the reported time period.
% Units—The percentage of total unit sales that are represented by the unit sales of this product.
Discounts—Total discounts applied to this product, if any.
% Discounts—Percentage discount given across all products.
