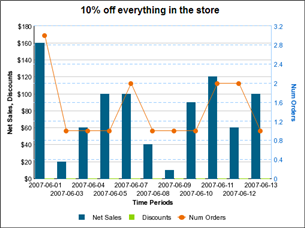
This report is a combination chart showing net sales and discounts as bars, and a line that represents the number of orders received. Place the cursor over a data point to show the exact values for that point.
The data is also shown in table form below the chart.