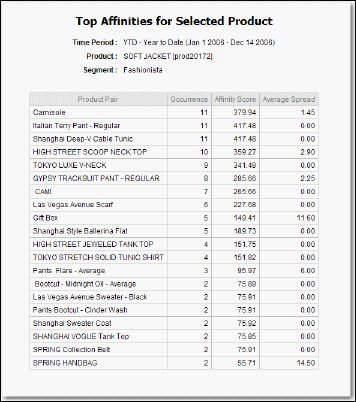
The report output is a chart. The chart lists all products that form an affinity pair with the selected product in the selected segment. For each of the pairs thus formed, it provides the occurrence, affinity score, and average spread.