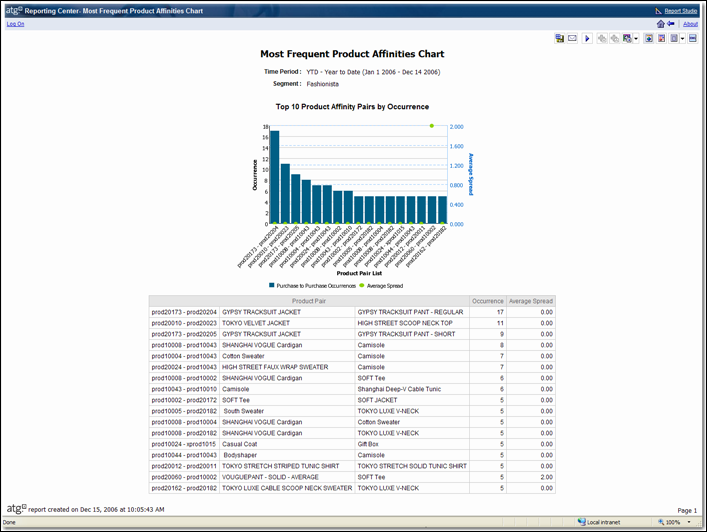
The report combines a bar chart showing the number of times each product pair occurred for that customer segment within the time frame you specified, with points indicating the average spread for each product pair.
Below the graph, the information is also presented in table form.