| Skip Navigation Links | |
| Exit Print View | |

|
Oracle Solaris Studio 12.3: Performance Analyzer MPI Tutorial Oracle Solaris Studio 12.3 Information Library |
| Skip Navigation Links | |
| Exit Print View | |

|
Oracle Solaris Studio 12.3: Performance Analyzer MPI Tutorial Oracle Solaris Studio 12.3 Information Library |
1. Performance Analyzer MPI Tutorial
About MPI and Performance Analyzer
MPI Software for Oracle Solaris 10 and Linux
MPI Software for Oracle Solaris 11
Prepare the Sample Source Code
Sample Code for ClusterTools and Open MPI
Sample Code for Oracle Message Passing Toolkit in Oracle Solaris 11
Compile and Run the Sample Program
Collecting Data on the ring_c Example
Viewing Function Details and Application Source Code
Filtering Data in the MPI Tabs
Make a Chart to Show Where Messages are Being Sent
Make a Chart to Show Which Ranks Waited Longest to Receive a Message
Look for Slow Message Effects on Time Spent in MPI Functions
Change to the directory that contains the ring_c.c source file, the ring_c executable, and the test.*.er directory.
Start the Performance Analyzer from the command line:
% analyzer
The Performance Analyzer opens a file browser for you to find and open an experiment. If not, choose File > Open Experiment.
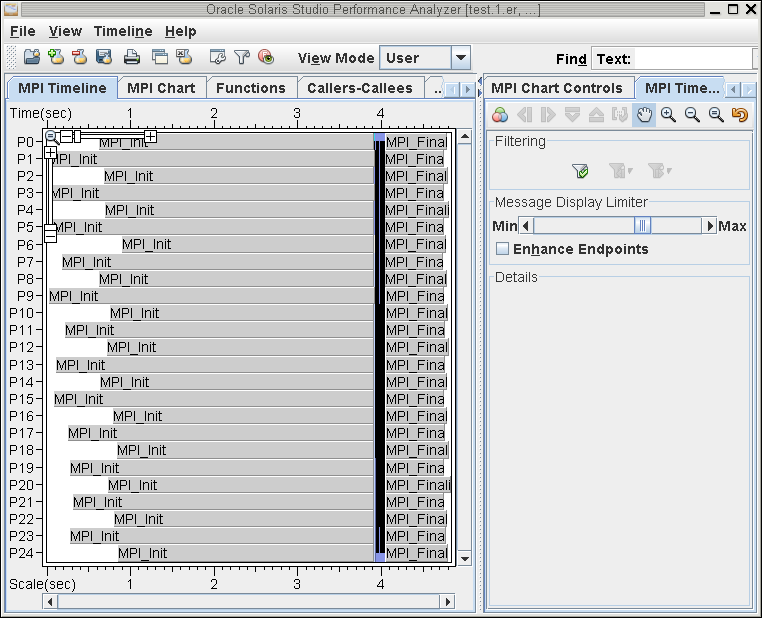
Find the test.*.er experiment that you just created and open it. The Performance Analyzer window should look similar to that below.

The experiment opens on the MPI Timeline tab. The MPI Chart tab is next to it. In the right panel you can see the MPI Chart Controls and MPI Timeline Controls tabs.
The MPI Timeline shows a view of the data over time as the program was run through the collector. The horizontal axis shows elapsed time. At the bottom, the horizontal axis shows relative time with the origin at the left edge of the display. At the top, the horizontal axis shows absolute time where the origin is the start of the data. The vertical axis shows MPI process rank. For each MPI process you can look horizontally to see what the process is doing as a function of elapsed time.
This initial view of the timeline answers the question: What is the time scale of program execution? The screen capture shows the time scale is approximately 5 seconds. However, the actual run time spans 3.90 to 4.05 seconds, the steady state of the application program. The collect tool uses MPI_Init and MPI_Finalize to set up and terminate data collection.