| Skip Navigation Links | |
| Exit Print View | |

|
Oracle Solaris Studio 12.3: Performance Analyzer MPI Tutorial Oracle Solaris Studio 12.3 Information Library |
| Skip Navigation Links | |
| Exit Print View | |

|
Oracle Solaris Studio 12.3: Performance Analyzer MPI Tutorial Oracle Solaris Studio 12.3 Information Library |
1. Performance Analyzer MPI Tutorial
About MPI and Performance Analyzer
MPI Software for Oracle Solaris 10 and Linux
MPI Software for Oracle Solaris 11
Prepare the Sample Source Code
Sample Code for ClusterTools and Open MPI
Sample Code for Oracle Message Passing Toolkit in Oracle Solaris 11
Compile and Run the Sample Program
Collecting Data on the ring_c Example
Filtering Data in the MPI Tabs
Make a Chart to Show Where Messages are Being Sent
Make a Chart to Show Which Ranks Waited Longest to Receive a Message
Look for Slow Message Effects on Time Spent in MPI Functions
Click on one of the MPI_Recv function events in the MPI Timeline tab.
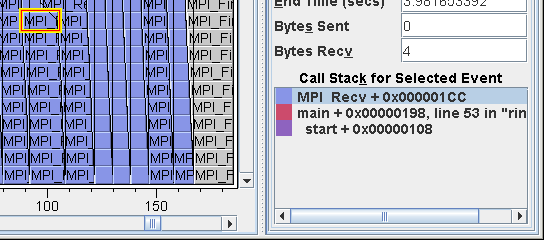
The function is highlighted in yellow, and details about the function are displayed in the MPI Timeline Controls tab on the right.

In the MPI Timeline Controls tab, you should see the call stack. If you see a button labeled Show Call Stack if available, click the button.
After a few moments, the call stack for the highlighted state should be shown in the MPI Timeline Controls tab:

When the Call Stack for Selected Event is displayed in the MPI Timeline Controls tab, click on main + 0x00000198, line 53 in "ring_c.c.
Click the Source tab in the main Performance Analyzer panel.
If you get a message such as Object file (unknown) not readable, make sure you selected the stack frame main + 0x00000198, line 53 in "ring_c.c.
Note - Source is only visible when the source is in the same location it was in when the program was run through the collector, or when it can be found in the $expts path as set in .er.rc or in View > Set Data Presentation > Search Path. Source also needs to be compiled with -g. If the source code is not visible, you may not have started the Analyzer from the directory containing the ring_c binary and source code. If this is the case, quit the Performance Analyzer and restart after you change to the directory containing ring_c.
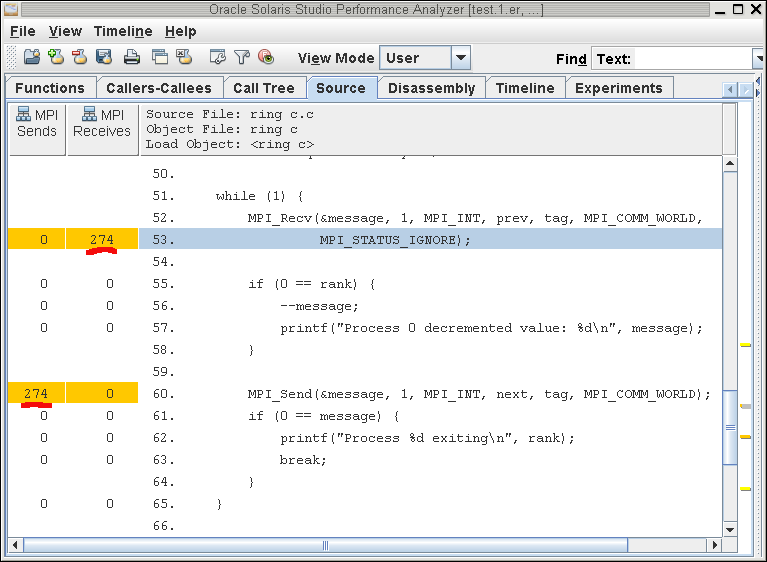
When the source is visible, it should show where main() calls the MPI_Recv() function. As shown below, MPI_Recv() is called from line 53 in the source. The metrics with high values are highlighted: 274 receives are associated with line 53, and 274 sends are associated with MPI_Send() on line 60.

Tip - The screen capture shows a reduced number of metrics. You can select more metrics to display by choosing View > Set Data Presentation > Metrics.
Click the Functions tab in the main Performance Analyzer panel.
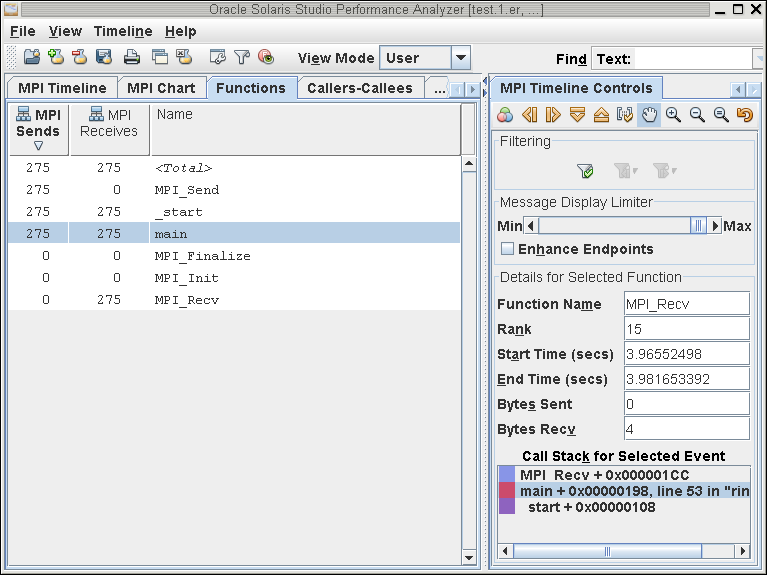
The Functions tab shows the same MPI Send and MPI Receive metrics in columns on the left side of a table. You can sort the table by clicking in the column headers.

Tip - The screen capture shows a reduced number of metrics in the Functions tab. You can select metrics to display by choosing View > Set Data Presentation > Metrics.
Click the MPI Timeline tab to return to the MPI timeline.
Do not click the regular Timeline tab because it does not apply to MPI programs.