| Skip Navigation Links | |
| Exit Print View | |

|
Oracle Solaris Studio 12.3: Performance Analyzer MPI Tutorial Oracle Solaris Studio 12.3 Information Library |
| Skip Navigation Links | |
| Exit Print View | |

|
Oracle Solaris Studio 12.3: Performance Analyzer MPI Tutorial Oracle Solaris Studio 12.3 Information Library |
1. Performance Analyzer MPI Tutorial
About MPI and Performance Analyzer
MPI Software for Oracle Solaris 10 and Linux
MPI Software for Oracle Solaris 11
Prepare the Sample Source Code
Sample Code for ClusterTools and Open MPI
Sample Code for Oracle Message Passing Toolkit in Oracle Solaris 11
Compile and Run the Sample Program
Collecting Data on the ring_c Example
Viewing Function Details and Application Source Code
Filtering Data in the MPI Tabs
Make a Chart to Show Where Messages are Being Sent
Make a Chart to Show Which Ranks Waited Longest to Receive a Message
Look for Slow Message Effects on Time Spent in MPI Functions
Reset the view to the original, maximum, zoomed-out setting by clicking the Zoom Reset button, which is located to the top left of the zoom sliders.

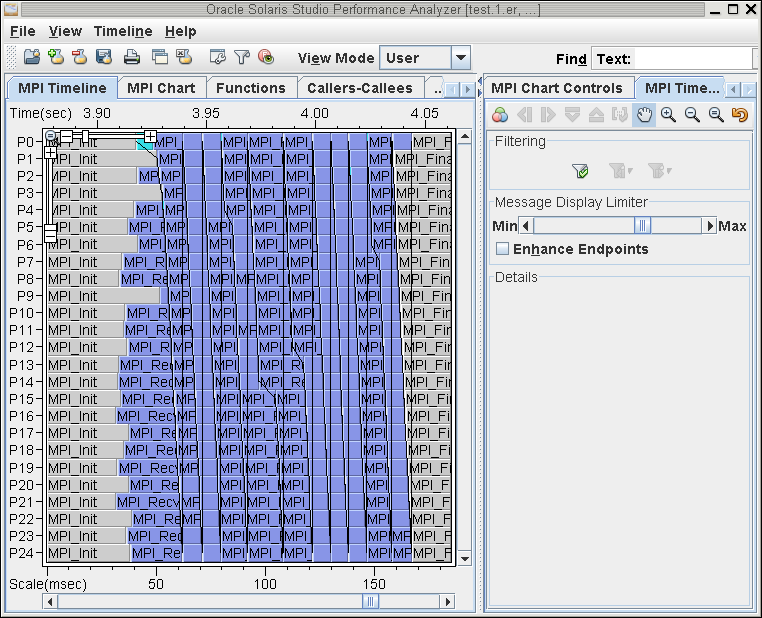
Zoom in on the activity area by dragging on the area horizontally with the mouse so it looks similar to what you see here.

In the zoomed in timeline, now you can see that the steady state portion of the program execution appears to be from 3.93 seconds to 4.03 seconds.
You can also see that MPI functions are color coded. The black lines drawn between events represent point-to-point messages exchanged by the MPI processes.
With this view of the timeline, you can answer the question: How long is one iteration before the pattern repeats? The answer is roughly 10 milliseconds. Look at the relative time scale at the bottom to see how often the loop seems to repeat.
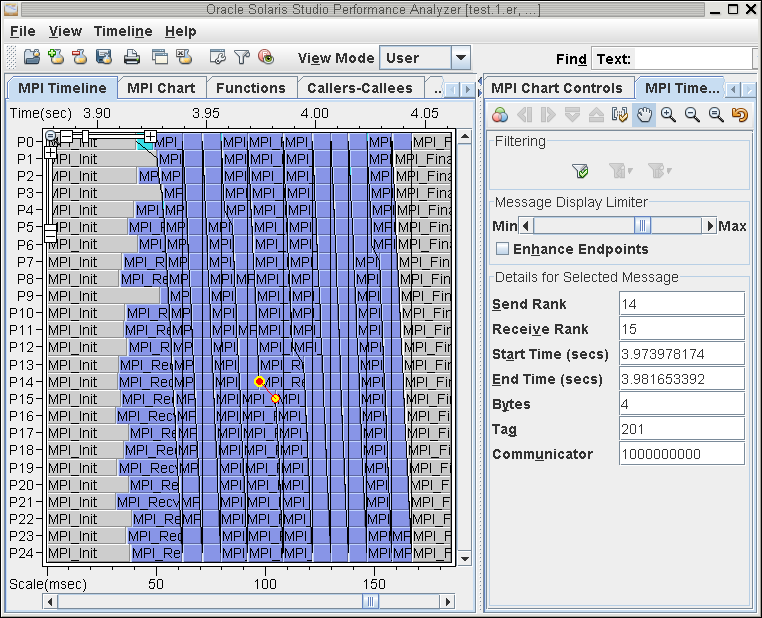
Click one of the black message lines.
The line turns red and details about the message are displayed in the right-hand panel MPI Timeline Controls tab.

In the MPI Timeline Controls tab, find the Message Display Limiter slider, then click and drag it to Min as shown.

The Message Display Limiter slider controls the number of message lines displayed on the screen. At Min, only functions are displayed in the MPI Timeline tab.
In this simple example, all of the messages can be displayed. However, displaying all messages in complex applications can overwhelm the tool and make the screen too cluttered to be usable. Select a lower limit to reduce the number of messages shown in the timeline. If fewer than 100% of the messages are shown, the messages used are those messages that are most costly in terms of the total time used in the message's send and receive functions.
Set the Message Display Limiter slider back to Max.