| Skip Navigation Links | |
| Exit Print View | |

|
Oracle Solaris Studio 12.3: Performance Analyzer MPI Tutorial Oracle Solaris Studio 12.3 Information Library |
| Skip Navigation Links | |
| Exit Print View | |

|
Oracle Solaris Studio 12.3: Performance Analyzer MPI Tutorial Oracle Solaris Studio 12.3 Information Library |
1. Performance Analyzer MPI Tutorial
About MPI and Performance Analyzer
MPI Software for Oracle Solaris 10 and Linux
MPI Software for Oracle Solaris 11
Prepare the Sample Source Code
Sample Code for ClusterTools and Open MPI
Sample Code for Oracle Message Passing Toolkit in Oracle Solaris 11
Compile and Run the Sample Program
Collecting Data on the ring_c Example
Viewing Function Details and Application Source Code
Filtering Data in the MPI Tabs
Make a Chart to Show Where Messages are Being Sent
Make a Chart to Show Which Ranks Waited Longest to Receive a Message
Look for Slow Message Effects on Time Spent in MPI Functions
Click the MPI Timeline tab if it is not already selected.
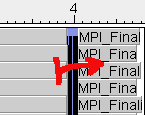
Zoom in on the data by clicking and dragging from the left to the right on any process row as shown by the directional arrow in the graphic below. When you release the mouse button, the area inside the box automatically expands to reveal a zoomed in view.

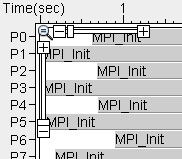
An alternative to clicking and dragging is to use the zooming slider controls in the top left of the timeline.

Use the horizontal slider to change the time scale. You'll see progressively smaller chunks of time, while still showing all the processes, as you zoom.
Use the vertical slider to zoom in on the MPI processes.
Click the Revert to Previous Zoom button in the MPI Timeline Controls tab shown below to go back to the previous level of zooming.

Click the Revert to Previous Zoom button a second time to return to the first zoom.
Pan across the data by sliding the scroll bars located at the bottom and the right of the timeline.
Alternatively you can toggle between a pointer that zooms and a pointer that pans by clicking the hand icon in the MPI Timeline Controls tab.

When the pointer is a hand, you can drag across the MPI Timeline to pan horizontally.