Debugging Information in Object Files and Executables
For the best results, compile your source files with the -g option to make your program more debuggable. The -g option causes the compilers to record debugging information in stabs or DWARF format into the object files along with the code and data for the program.
dbx parses and loads debugging information for each object file (module) on demand when the information is needed. You can use the module command to ask dbx to load debug information for any specific module, or for all modules. See also Finding Source and Object Files.
Object File Loading
When the object (.o) files are linked together, the linker can optionally store only summary information into the resulting load object. This summary information can be used by dbx at runtime to load the rest of the debug information from the object files themselves instead of from the executable file. The resulting executable has a smaller disk-footprint, but requires that the object files be available when dbx runs.
You can override this requirement by compiling object files with the -xs option to cause all the debugging information for those object files to be put into the executable at link time.
If you create archive libraries (.a files) with your object files and use the archive libraries in your program, then dbx extracts the object files from the archive library as needed. The original object files are not needed at that point.
The only drawback to putting all the debugging information into the executable file is using additional disk space. The program does not run more slowly, because the debugging information is not loaded into the process image at runtime.
The default behavior when using stabs is for the compiler to put only summary information into the executable.
Object files can be created with DWARF using the –xs option. For more information, see Index DWARF (-xs[={yes|no}]).
Note - The DWARF format is significantly more compact than recording the same information in stabs format. However, because all the information is copied into the executable, DWARF information can appear to be larger than stabs information.
For more information about the stabs index, see the Stabs Interface guide found with the path install-dir/solarisstudio12.4/READMEs/stabs.pdf.
Compiler and Linker Options to Support Debugging
Compiler and linker options give users more freedom to generate and use debug information. Compilers generate an Index for DWARF, similar to index stabs The index is always present and results in faster dbx start-up time, as well as other improvements when debugging with DWARF.
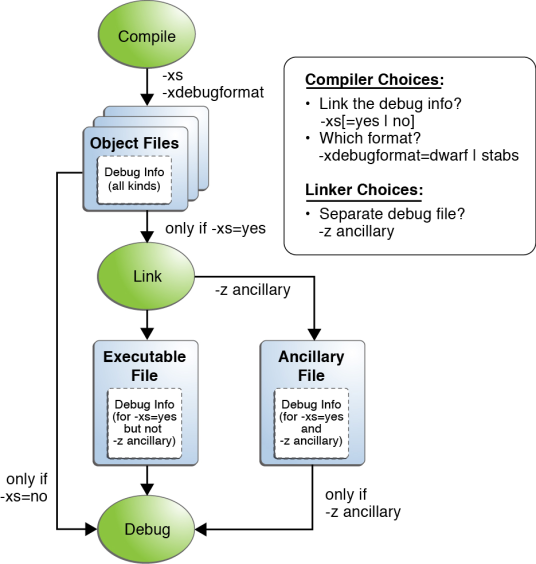
The following is a diagram of the different kinds and locations of debug information, specifically highlighting where the debug data resides:
Figure 1 Flow of Debug Information

Index DWARF (–xs[={yes|no}])
DWARF by default is loaded into the executable file. The new index makes it possible to leave the DWARF in the object files with the –xs=no option. This results in a smaller executable size and a faster link. The object files must be retained in order to debug. This is similar to how stabs works.
Separate Debug File (–z ancillary[=outfile])
The Oracle Solaris 11.1 linker can send debug information to a separate ancillary file while building the executable. A separate debug file is useful for environments where all the debug information must be moved, installed, or archived. An executable can be run independently, but can also be debugged by people with a copy of its separate debug file.
dbx continues to support the use of the GNU utility objcopy to extract debug information into a separate file, but using the Oracle Solaris linker has the following advantages over objcopy:
-
The separate debug file is produced as a by-product of the link
-
A program which was too large to be linked as one file links as two files
For more information, see Ancillary Files (Oracle Solaris Only).
Minimizing Debug Information
The –g1 compiler option is intended for minimal debuggability of deployed applications. Compiling your application with this option produces the file and line number, as well as simple parameter information that is considered crucial during postmortem debugging. For more information, see the compiler man pages and the compiler user guides.
Listing Debugging Information for Modules
The module command and its options help you to keep track of program modules during the course of a debugging session. Use the module command to read in debugging information for one or all modules. Normally, dbx automatically and “lazily” reads in debugging information for modules as needed.
To read in debugging information for a module:
(dbx) module [-f] [-q] name
To read in debugging information for all modules:
(dbx) module [-f] [-q] -a
where:
- -a
-
Specifies all modules
- -f
-
Forces reading of debugging information, even if the file is newer than the executable.
- -q
-
Specifies quiet mode.
- -v
-
Specifies verbose mode, which prints language, file names, and so on. This is the default.
To print the name of the current module, type:
(dbx) module
Listing Modules
The modules command helps you keep track of modules by listing module names.
To list the names of modules containing debugging information that have already been read into dbx, type:
(dbx) modules [-v] -read
To list the names of all program modules regardless of whether they contain debugging information:
(dbx) modules [-v]
To list all program modules that contain debugging information:
(dbx) modules [-v] -debug
where:
- -v
-
Specifies verbose mode, which prints language, file names, and so on.