 to display the Editor panel. To view the dataset objects for a specific
visualization, click the visualization in the dashboard.
The Editor panel contains all of the dataset objects displayed as data
in a visualization on a dashboard.
To display the Editor panel, from the View
menu, select Editor Panel. If
the Editor panel is hidden behind another panel, click the Editor
icon  to display the Editor panel. To view the dataset objects for a specific
visualization, click the visualization in the dashboard.

You can add, replace, or remove data from a visualization, and so on:
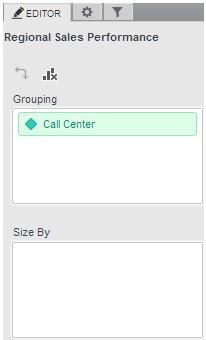
To add data to the visualization, click and drag dataset objects from the Datasets panel onto the appropriate area in the Editor panel, so that an indicator line is displayed in the location in which you want to place the dataset objects. The dataset objects are added to the visualization and displayed. In the image above, the Call Center attribute has been added to the Grouping area of a visualization. You can select multiple dataset objects at the same time by pressing CTRL and clicking each dataset object to select it.
To replace the data displayed in a visualization, click and drag a dataset object from the Datasets panel onto the dataset object on the Editor panel that you want to replace, so that a blue arrow icon is displayed next to the cursor. The data is replaced in the visualization and displayed.
To move or pivot data from one area of the visualization to another, click and drag a dataset object from its current location in the Editor panel to the appropriate area in the Editor panel. For example, to move an attribute from the rows of a Grid visualization to the columns, click and drag the attribute from the Rows area to the Columns area. Depending on the type of visualization, you can also move data by dragging dataset objects directly onto the visualization. For steps to create and display data in a specific type of visualization, see the appropriate topic in the related links below. You can move multiple attributes or metrics from one area of the visualization to another at the same time. Press CTRL and click each dataset object to select it, then drag the objects to their new location in the Editor panel.
To remove data from the visualization, select each dataset object to remove, then press DELETE. You can select multiple dataset objects at the same time by pressing CTRL and clicking each dataset object to select it.
To swap
the dataset objects in the rows and columns of the visualization,
click the Swap icon  .
.
For a grid,
to display or hide subtotals, click the Show
Totals icon  .
.
To remove
all data from the visualization, click the Clear
All icon  .
.
You can also use the Editor panel to:
Sort and pivot data in a visualization. For steps, see Analyzing data using visualizations in a dashboard.
Display subtotals in a visualization. For steps, see Formatting visualizations.
Change the number formatting applied to a metric. For steps, see Formatting visualizations.
Change the attribute forms displayed for an attribute. For steps, see Formatting visualizations.
Rename dataset objects in a visualization. For steps, see Formatting visualizations.
Create new metrics based on metrics already displayed in the visualization. For steps, see Adding derived metrics to a dashboard.
Create new attributes based on attributes in the dashboards. For steps, see Attribute Editor.
Group attribute elements to display and calculate your data. For steps, see Grouping attribute elements in a dashboard
Creating a Graph visualization
Creating a Heat Map visualization
Creating a Network visualization
Dashboard Editor: Datasets panel
Dashboard Editor: Filter panel
Dashboard Editor: Visualization Gallery
_____________________________
Copyright © 2019, Oracle and/or its affiliates. All rights reserved.
Legal Notices