2 Dashboard
The Dashboard is the first screen you see when you log in. It consists of multiple portlets, each showing a different view of your tape library system.
This chapter includes the following sections:
Using the Dashboard
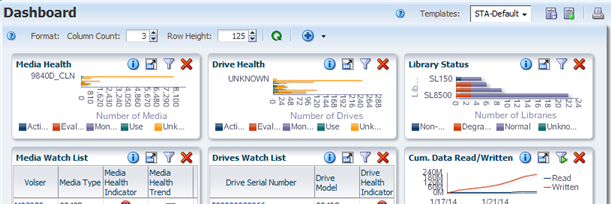
Following is an example of the default Dashboard delivered with STA. Your display may differ if another Dashboard template has been assigned as the default for your STA username.
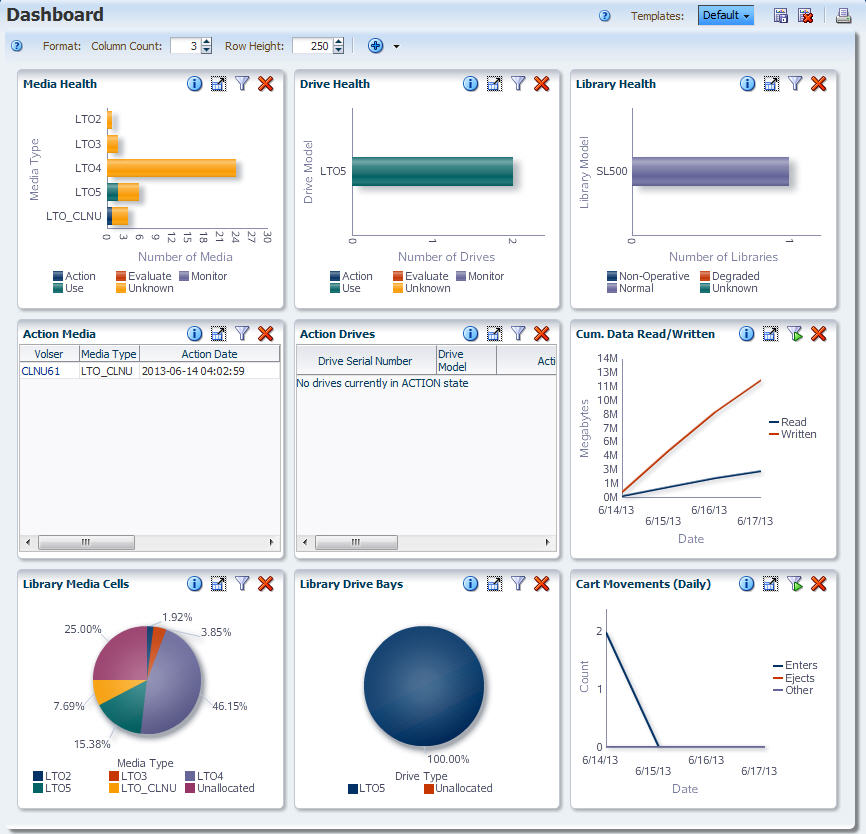
Description of the illustration ''if_dashdefault.jpg''
Customizing the Dashboard
The Dashboard is fully customizable. There are over 50 different portlets to display, each one showing a different set of analytic and summary data collected by STA. You can include a maximum of 30 portlets at one time. See "Portlet Types" for descriptions of the available portlets.
You can rearrange portlets, change their sizes, and filter the data that is shown on each portlet. See "Dashboard Tasks" for instructions.
Dashboard Templates
If you have Operator or Administrator privileges, once you have arranged a Dashboard the way you like, you can save the display as a customized Dashboard template. The order and size of the portlets and any applied filters are saved as part of the template.
Dashboard templates are the basis of Executive Reports. See "Executive Reports" for details.
Times Displayed on the Dashboard
Because the Dashboard reports high-level summaries for your entire tape library system, all data is reported in UTC time. In contrast, all other STA screens report times adjusted for your local time zone (as specified in the time zone preferences for your STA username; see theSTA User's Guide for details).
In the sample Maximum Mount Time (Hourly) graph below, the selected mount shows a date and time of 3/18/14 9:00 AM. However, if you were to view this mount on the Exchanges Overview screen, the date and time would be adjusted to your time zone preference. For example, if your preference setting were UTC-5, the selected mount would show a date and time of 3/18/14 4:00 AM.on the Exchanges Overview screen.
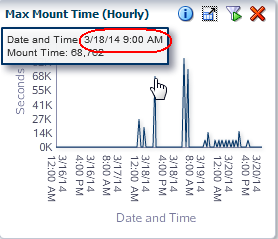
Description of the illustration ''if_dashutc.png''
Linking to Detail Screens
Some Dashboard portlets provide links to other STA screens, allowing you to drill down to more detail about the selected resources. See "Filtering Using Dashboard Graphics" and "Apply a Filter From the Dashboard" for additional information.
Graph Links
Bar charts, pie charts, and area charts bring up the List View for the selected resource, with a filter applied to the screen display. The following screens show how clicking on a pie chart section brings up the Media – Overview screen List View, filtered to show only the selected media type.
Description of the illustration ''if_dashpielinkfr.jpg''
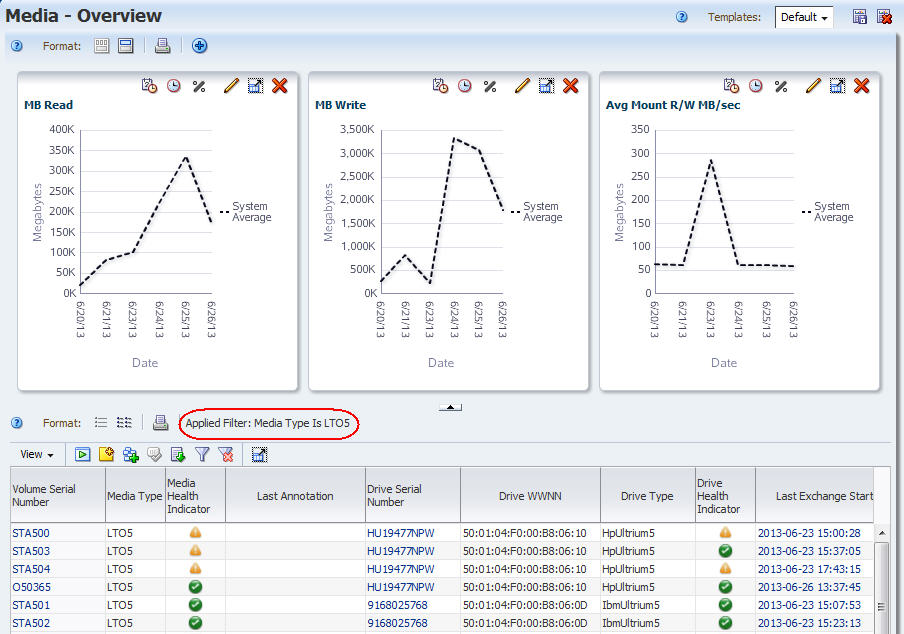
Description of the illustration ''if_dashpielinkto.jpg''
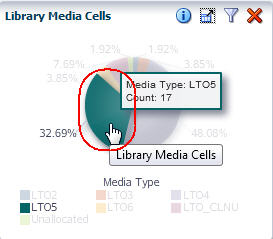
Some graph sections may not have associated Overview screen information to display. For example, in the Library Media Slots portlet below, there is no media detail available for the Unallocated category, which represents media slots that are empty or not activated. Therefore, clicking on this section of the pie has no effect.
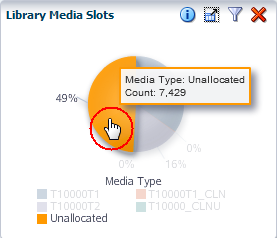
Description of the illustration ''if_dashpienolink.png''
Text Links
Some table portlets include text links, which bring up the Detail View for the selected resource. The following screens show how the drive serial number link on a Dashboard portlet brings up the Drives – Overview screen Detail View for the selected drive. See the STA Screen Basics Guide for additional information on text links.
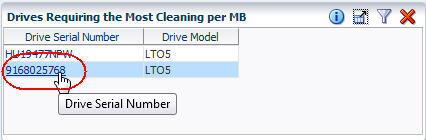
Description of the illustration ''if_dashtablelinkfr.jpg''
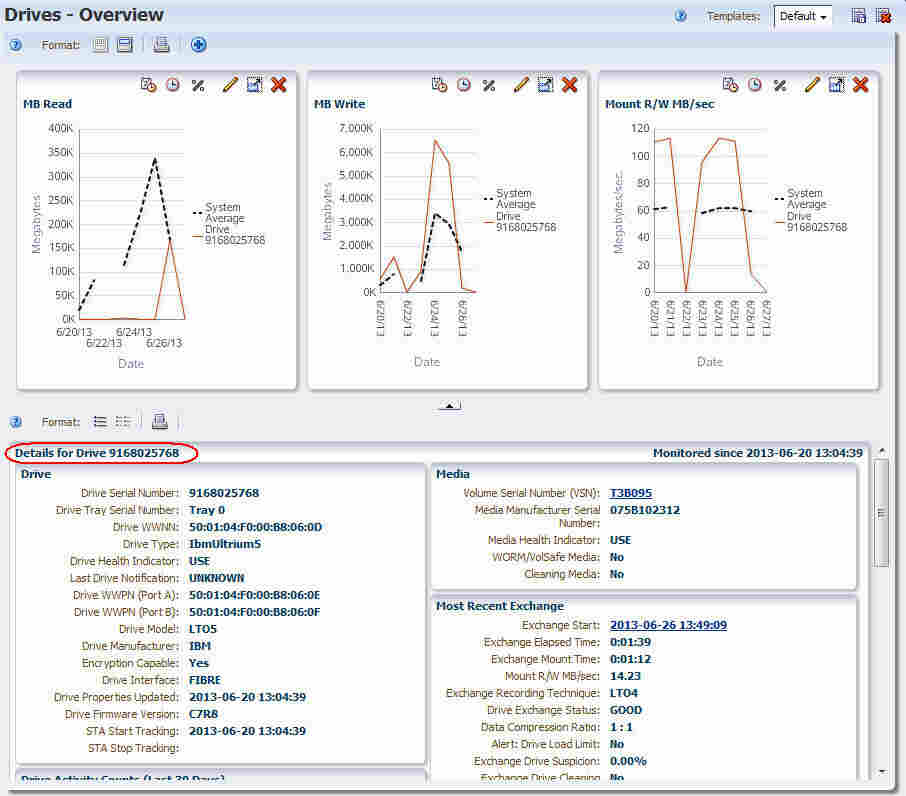
Description of the illustration ''if_dashtablelinkto.jpg''
Dashboard Layout
The Dashboard is divided into equal-sized portlets that are arranged in columns and rows. There can be from one to five columns, and any number of rows. Rows can be 100 to 600 pixels in height.
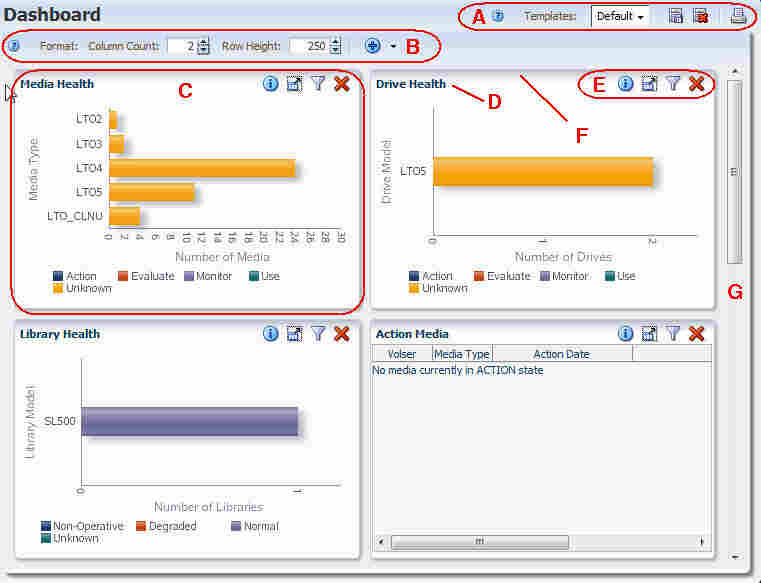
Description of the illustration ''if_dashlayout.jpg''
| Item | Name | Description |
|---|---|---|
| A | Template Toolbar | Provides direct access to commands for applying and managing templates. This toolbar appears on most STA screens. See "Templates Toolbar" for details. |
| B | Dashboard Toolbar | Provides direct access to commands for managing the Dashboard display. See "Dashboard Toolbar" for descriptions of each icon. |
| C | Dashboard portlet | Dashboard portlets are arranged in columns and rows. Each portlet shows a different high-level view of your tape library system. See "Dashboard Portlets" for details. |
| D | Dashboard portlet title | Identifies the type of data in the portlet. See "Dashboard Portlets" for details. |
| E | Dashboard portlet toolbar | Provides direct access to commands for manipulating the display of this Dashboard portlet. See "Dashboard Portlet Toolbar" for details. |
| F | Dashboard portlet border | Shaded area at the top of the Dashboard portlet. Allows you to grab the portlet and move it. See the STA Screen Basics Guide for details. |
| G | Vertical scrollbar | Appears only if there are additional rows below the bottom of the screen. |
Dashboard Toolbar
The Dashboard Toolbar appears at the top of the Dashboard. It provides direct access to frequently used commands for controlling the overall display of the Dashboard.
Description of the illustration ''if_dashtoolbar.jpg''
| Icon | Name | Description |
|---|---|---|
| Help | Displays help for the Dashboard.
Related Topic: "Help" |
|
| Column Count | Displays the number of columns in the Dashboard display and allows you to change it.
Related Topic: "Change the Dashboard Column and Row Layout" |
|
| Row Height | Displays the height of each Dashboard row, in pixels, and allows you to change it.
Related Topic: "Change the Dashboard Column and Row Layout" |
|
 |
Add Portlet menu | Menu provides options for you to add selected graph, table, or report portlets to the Dashboard display.
Related Topic: "Add a Dashboard Portlet" |
Dashboard Portlet Toolbar
The Dashboard Portlet toolbar appears at the top of each Dashboard portlet. It provides direct access to frequently used commands for modifying the portlet.
Description of the illustration ''if_dashpanetoolb.jpg''
| Icon | Name | Description |
|---|---|---|
| Panel Information | Displays a description of the portlet and allows you to add an annotation, which appears on Executive Reports.
Related Task "Add or Change a Dashboard Portlet Annotation" |
|
| Detach Pane | Detaches the portlet from the screen and displays it in a separate window in the browser foreground.
Related Topic: the STA Screen Basics Guide |
|
| Filter Data | Displays a dialog box that allows you to define, modify, or reset filter criteria and apply them to the portlet. The first icon indicates there is no filter in effect; the second icon indicates a filter has been applied.
Related Topic: "Apply or Change a Dashboard Portlet Filter" and "Clear a Dashboard Portlet Filter" |
|
| Remove Pane | Deletes the portlet from the Dashboard display.
Related Topic: the STA Screen Basics Guide |
Portlet Types
The following portlet types are available:
See "Dashboard Portlets" for descriptions of the available portlets.
Graph Portlets
The following types of graph portlets are available. See "Graph Portlets" for descriptions of individual portlets. See the STA Screen Basics Guide for additional details about the display and uses of the various graph types.
-
Bar chart—Used for point-in-time data.
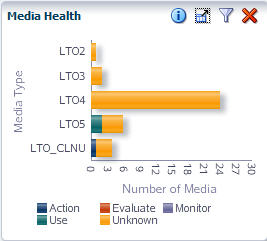
Description of the illustration ''if_dashbar.jpg''
-
Pie charts—Used for point-in-time data.
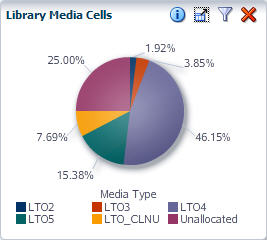
Description of the illustration ''if_dashpie.jpg''
-
Line graphs—Used for date and time range data.
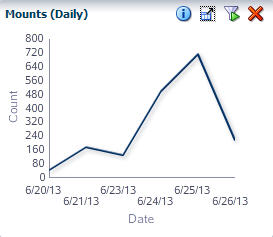
Description of the illustration ''if_dashline.jpg''
For line graphs where there is only a single point of data—for example, a monthly graph where only a single month's data exists—a bar graph is displayed instead. Following is an example.
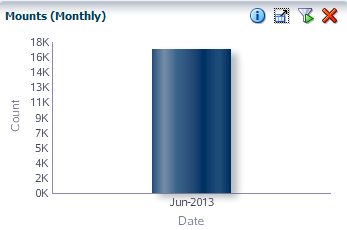
Description of the illustration ''if_graphlinebar.png''
Table Portlets
The following types of table portlets are available. See "Table Portlets" for descriptions of individual portlets.
-
List table—Displays data in a traditional list table.
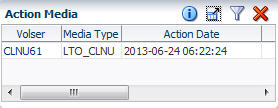
Description of the illustration ''if_dashlist.jpg''
-
Trend report—Includes an embedded spark chart showing start, end, high, and low values over the range. See the STA Screen Basics Guide for additional information about spark charts.
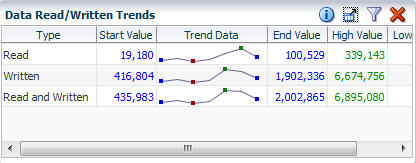
Description of the illustration ''if_dashtrend.jpg''
Report Portlets
Report portlets are text-only windows showing current information. See "Report Portlets" for descriptions of individual portlets.
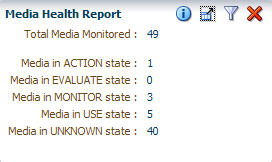
Description of the illustration ''if_dashreport.jpg''
Mobile Dashboard Display
STA supports the Dashboard display on mobile devices. You can display any Dashboard template available to your STA username. Regardless of your user role, however, the mobile display is read-only. You cannot link to other screens from the Dashboard nor can you rearrange portlets and save templates. Therefore, Dashboard templates accessed from a mobile device must first be created through a desktop STA connection.
The Dashboard display is automatically optimized for your mobile device. For example, a three-column template may display in single column on a mobile phone but two columns on a tablet. Device rotation is also supported. See Figure 2-1 and Figure 2-2 for sample Dashboard displays.
Figure 2-1 Sample Mobile Dashboard Display on a Tablet
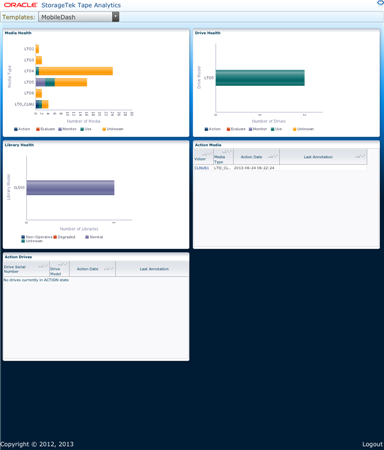
Description of ''Figure 2-1 Sample Mobile Dashboard Display on a Tablet''
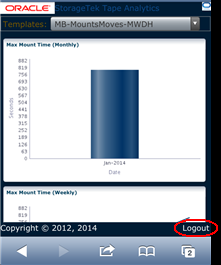
Figure 2-2 Sample Mobile Dashboard Display on a Mobile Phone
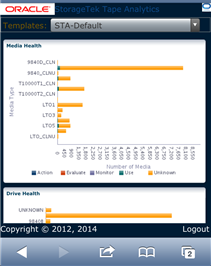
Description of ''Figure 2-2 Sample Mobile Dashboard Display on a Mobile Phone''
Mobile Display Requirements
The following table lists the device operating system requirements for mobile display. In addition, all devices must run the default browser version provided with the device operating system.
| Device Type | Operating System |
|---|---|
| Apple iPhone and iPad | iOS 5.0 and above
|
| Google Android | Android 2.3 and above
|
| Blackberry | Blackberry 7 OS and above |
| Windows tablets | Latest version |
Accessing STA From Your Mobile Device
Your mobile device must have access to the network on which STA is running.
-
If the network is publicly accessible, you can simply open a browser window on your mobile device, enter the URL of the STA application, and then log in with your STA username and password. See "Log In to STA" for instructions.
-
If the network is protected by a firewall or virtual private network (VPN), see your system administrator for access instructions.
Dashboard Tasks
These procedures allow you to modify the appearance and arrangement of the Dashboard. If you have Operator or Administrator privileges, once you have modified the Dashboard display, you can save the arrangement as a Dashboard template.
You can also perform the following procedures with the Dashboard, and the instructions are the same as for other STA display areas.
-
Detach a Dashboard portlet. See the STA Screen Basics Guide
-
Remove a Dashboard portlet. See the STA Screen Basics Guide.
-
Save the current Dashboard display as a new or modified template (Operator and Administrator users only). See "Create a Template" or "Modify a Template" for detailed instructions.
Change the Dashboard Column and Row Layout
You can change the size of the individual Dashboard portlets by modifying the column count and row height. Resizing portlets in this way can help to clarify the data.
-
In the Navigation Bar, select Home, then select Dashboard.
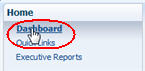
Description of the illustration ''if_navdash.png''
The default Dashboard for your STA username is displayed.
-
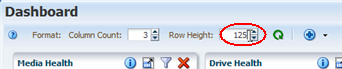
To change the number of portlet columns, and therefore the width of each portlet, enter a number in the Column Count field in the Dashboard toolbar. You can also use the spinbox control arrows to change the field value. Valid entries are 1 to 5.
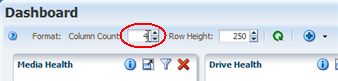
Description of the illustration ''if_dashcolcountchg.png''
The change takes effect as soon as you press Enter or move the cursor to another area of the screen.
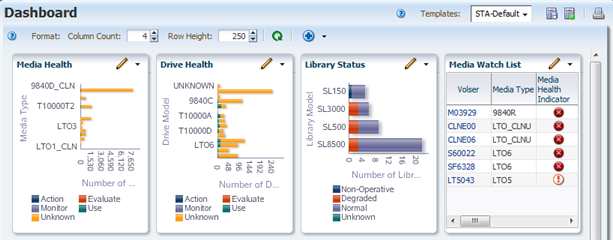
Description of the illustration ''if_dashcolcountdone.png''
Note:
If you increase the number of columns, the Dashboard Portlet toolbars may be truncated due to lack of space. Any hidden icons are available from the menu at the far-right of the toolbar.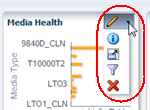
-
To change the height of each portlet, enter a number in the Row Height field in the Dashboard toolbar. You can also use the spinbox control arrows to change the field value. Valid entries are 100 to 600.
Description of the illustration ''if_dashrowheightchg.png''
The change takes effect as soon as you press Enter or move the cursor to another area of the screen.
Description of the illustration ''if_dashrowheightdone.png''
Add a Dashboard Portlet
Use this procedure to add a portlet to the Dashboard display. You can include a maximum of 30 portlets.
You can add more than one instance of the same type of portlet, and you can filter each instance differently so you can focus on different data. For example, you may want to add two separate Media Health portlets: one for big libraries (SL3000 and SL8500) and one for small (SL150 and SL500).
Note:
Adding a large number of Dashboard portlets may result in the portlet legends being truncated or not displayed at all. If this occurs, you may want to remove some portlets to restore the legends.-
In the Navigation Bar, select Home, then select Dashboard.
Description of the illustration ''if_navdash.png''
The default Dashboard for your STA username is displayed.
-
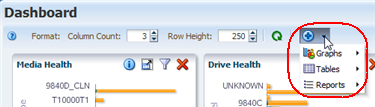
In the Dashboard toolbar, select the Add Portlet menu.
Description of the illustration ''if_dashaddportletmenu.png''
Submenus are listed for the portlet types—Graphs, Tables, or Reports.
-
From the appropriate portlet submenu, select the specific portlet you want to add. Time-related portlets provide you with options for Monthly, Weekly, Daily, or Hourly time increments.
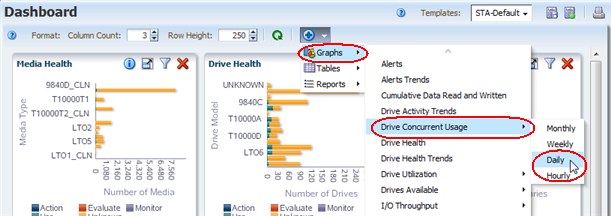
Description of the illustration ''if_dashaddgrportlet.png''
The portlet is added to the end of the Dashboard display. You may need to use the vertical scrollbar to view it. To move the portlet to a new position, see the STA Screen Basics Guide.
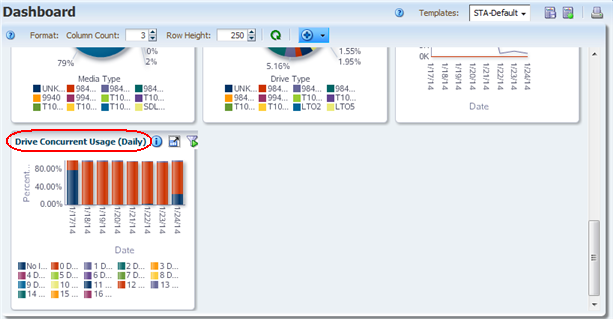
Description of the illustration ''if_dashgrportletdone.png''
Add or Change a Dashboard Portlet Annotation
Use this procedure to add or modify a user-defined text annotation for the current portlet. The annotation appears on Executive Reports and can be used for a variety of purposes, such as clarifying the information displayed or drawing attention to specific data.
Note:
The text you enter is specific to the current Dashboard template. For example, if the Drive Health portlet appears in several Dashboard templates, each instance of the Drive Health portlet can have a different annotation associated with it.Note:
Annotation text is specific to your STA username. For example, annotations entered by one user on the Drive Health portlet do not appear to a user logged in with a different STA username.Annotations can be up to 1,000 ASCII characters in length. There are no formatting options, such as boldface or color. Also, spacing options, such as forced line feeds, are not preserved on the Executive Reports.
For an annotation to appear on an Executive Report, the current Dashboard view must be saved as a template. Additionally, if you modify a portlet annotation, any existing Dashboard templates using that portlet must be re-saved in order for the updated annotation to appear on Executive Reports. See "Create a Template" and "Modify a Template" for detailed instructions.
-
In the Navigation Bar, select Home, then select Dashboard.
Description of the illustration ''if_navdash.png''
The default Dashboard for your STA username is displayed.
-
Click Panel Information in the Portlet Toolbar of the Dashboard portlet you want to annotate.
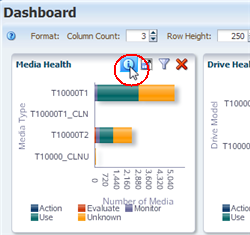
Description of the illustration ''if_dashportnote.png''
The Annotate dialog box appears.
-
Enter the annotation text you want to appear in this instance of the portlet, and click Save Annotation to save the information. Annotations can be up to 1,000 characters in length.
Note:
To better view the text, you can resize the dialog box by grabbing the lower-right corner of the text area and stretching it.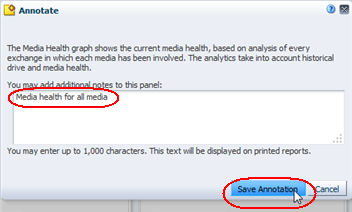
Description of the illustration ''if_dashannotate.png''
Once saved, the annotation is not visible on the Dashboard portlet itself, but can be viewed by clicking Panel Information again. To have the annotation appear on an Executive Report based on this Dashboard display, you must save the display as a new template or an update to an existing template.
Caution:
To retain this annotation for future login sessions, you must save the current display as a template or an update to an existing template. If you log out of this session without saving the template, the annotation will be lost for future login sessions and Executive Report runs.
Apply or Change a Dashboard Portlet Filter
Use this procedure to change the data displayed on a Dashboard portlet by applying a new filter or modifying an existing one.
Note:
To remove all filter criteria from a Dashboard portlet, see "Clear a Dashboard Portlet Filter".If a filter has been applied to a portlet, the Applied Filter icon is displayed. Some portlets are filtered by default, so they include this icon already. Hover the mouse over the icon to display a description of the applied filter.
The criteria for filtering Dashboard portlets varies by portlet type. For example, you can filter most line graphs by a date range, but you cannot do so for a pie chart.
-
In the Navigation Bar, select Home, then select Dashboard.
Description of the illustration ''if_navdash.png''
The default Dashboard for your STA username is displayed.
-
On the Dashboard Portlet toolbar of the portlet you want to modify, click Filter. If the portlet already has a filter applied, click Applied Filter.
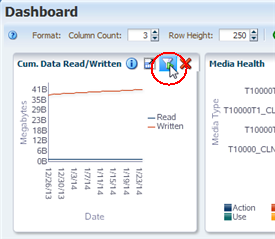
Description of the illustration ''if_dashportfilter.png''
The Filter Data dialog box appears. If no filter has been applied, the dialog box displays the default settings. If a filter is already in effect, the criteria are displayed in the dialog box.
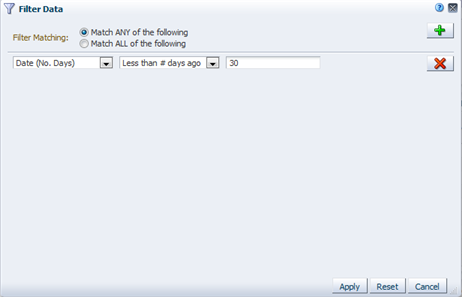
Description of the illustration ''if_dashportfilterbef.png''
-
Specify the filter criteria in the dialog box, as follows:
-
In the Filter Matching field, select one of the options to indicate whether you want to match any or all of the criteria you specify. See "Filter Data Dialog Box" for details.
-
Indicate the filter criteria for as many portlet attributes as you want. Click Add new filter criteria row to add more criteria.
-
To remove filter criteria, click Remove this filter criteria row.
-
-
Verify that your specifications are correct, and then click Apply.
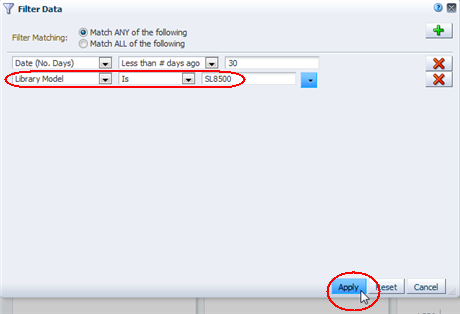
Description of the illustration ''if_dashportnewfilter.png''
The following updates are made to the Dashboard portlet:
-
The portlet displays a summary or analysis of only the records that match the criteria you have specified.
-
The Dashboard Portlet Toolbar displays the Applied Filter icon.
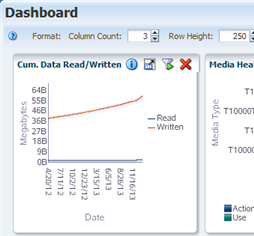
Description of the illustration ''if_dashportfilterdone.png''
-
Clear a Dashboard Portlet Filter
Use this procedure to remove all filter criteria from a Dashboard portlet. Unlike graph portlets on other screens, there is no Reset Filter icon available on Dashboard portlets.
Note:
To remove selected (not all) filter criteria from a Dashboard portlet, see "Apply or Change a Dashboard Portlet Filter".-
In the Navigation Bar, select Home, then select Dashboard.
Description of the illustration ''if_navdash.png''
The default Dashboard for your STA username is displayed.
-
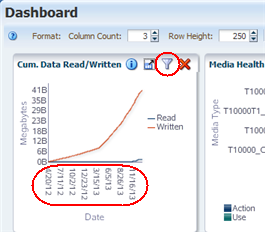
Click Filter Data in the Dashboard Portlet Toolbar.
Description of the illustration ''if_dashportfilter.png''
The Filter Data dialog box appears, and all selection criteria currently in effect are indicated.
-
Click Reset.
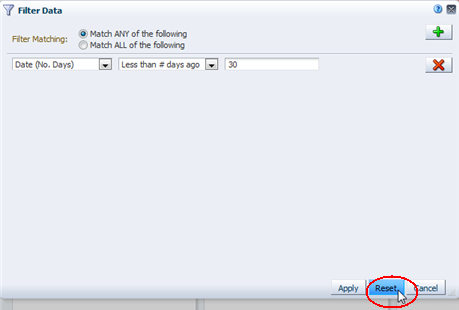
Description of the illustration ''if_dashportfilterreset.png''
The following updates are made to the Dashboard Portlet:
-
All filter criteria are removed from the portlet so it displays all available records.
-
The Dashboard Portlet Toolbar displays the Filter icon.
Description of the illustration ''if_dashportresetdone.png''
-
Display the Dashboard on a Mobile Device
Use this procedure to display a read-only version of the Dashboard on a mobile device, such as a mobile phone or tablet. See "Mobile Display Requirements" to verify that your device is supported.
Note:
Before performing this procedure, you must obtain access to the network on which STA is running. See "Accessing STA From Your Mobile Device" for details.Note:
The examples in this procedure are from a mobile phone display.-
Start a browser window on your mobile device and log in to STA. See "Log In to STA" for details.
The default Dashboard template for your STA username is displayed.
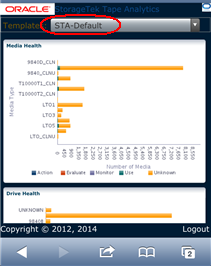
Description of the illustration ''if_dashphonedef.png''
-
To change the display, select the template you want to view from the Templates menu.
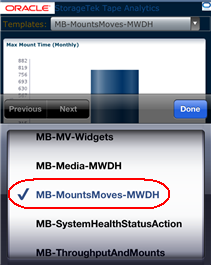
Description of the illustration ''if_dashtmptselphone.png''
-
To log out, click the Logout link at the bottom of the screen.
Description of the illustration ''if_dashlophone.png''