13 Using STA to Answer Tape Environment Questions
This chapter combines elements and procedures described in the previous chapters to address common questions about tape storage operations and health. The methods described are not exhaustive, but are meant as examples of some ways you can use STA to answer these and similar questions, and in the process build your expertise in using the STA product.
Each procedure includes a "Referenced Tasks" section, which refers to the elements and procedures from previous chapters.
This chapter includes the following topics:
Drive and Media Health Questions
| Question | Task |
|---|---|
| Which drives and media have had the most errors in the last 30 days? Are there any correlations between the two? | "Report the Media and Drive With the Most Errors" |
| Which drives have had the most errors this week? Have their error rates gone up? | "Report Trends in Drive Error Rates" |
| Which drives have had significantly declining efficiency over time? | "Report Drive Efficiency Trends" |
| Is the drive that failed twice today the same one that caused problems two months ago? | "Report Trends in Drive Failures" |
| At 9:00 am today, one of our tape jobs experienced an error. Which drive and media were involved? Have they also experienced other errors? | "Report Information to Help Troubleshoot Tape Job Errors" |
| What critical errors were reported to STA last month? Is the total number trending up, down, or staying stable? | "Report Trends in Critical Errors" |
Report the Media and Drive With the Most Errors
These procedures address the questions, "Which drives and media have had the most errors in the last 30 days? Are there any correlations between the two?"
The following methods are described:
Referenced Tasks
-
STA Screen Basics Guide, to sort by a column
-
STA Screen Basics Guide, to apply library resources to graphs
Report Drives With the Most Errors
-
In the Navigation Bar, select Tape System Hardware, then select Drives Overview.
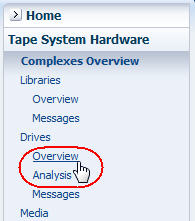
Description of the illustration ''exp_navdrvovw.jpg''
-
In the Templates menu, apply the "STA-Drive-Health" template.
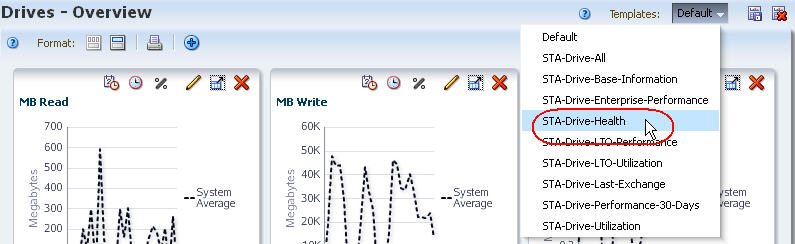
Description of the illustration ''exp_tmptdrvhealth.jpg''
-
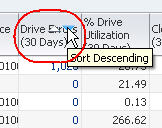
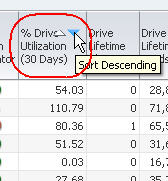
In the Drive Errors (30 Days) column, click the Sort Descending arrow.
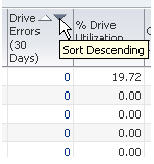
Description of the illustration ''exp_sortdescending.jpg''
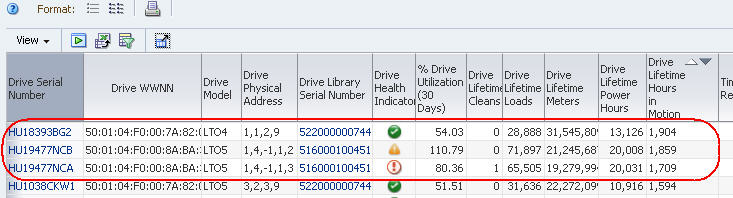
The drives with the most errors are brought to the top of the list.
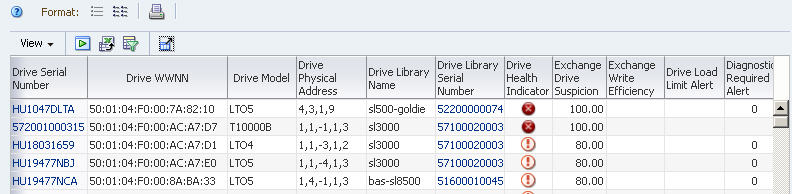
Description of the illustration ''exp_drverrorsmost.jpg''
-
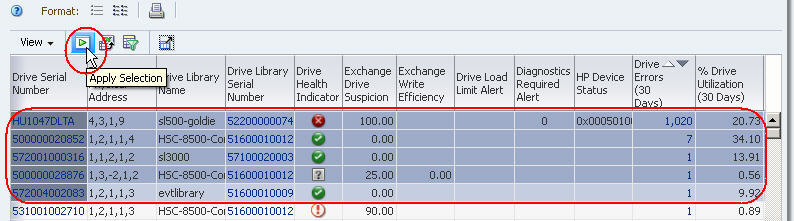
Use the following steps to add selected drives to the graphs.
Adding the drives to the graphs allows you to compare their attribute values against the system average. By default, graphs always include the system average.
-
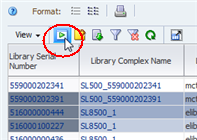
In the List View table, select the drives you want to add to the graphs.
-
Click Apply Selection on the Table Toolbar.
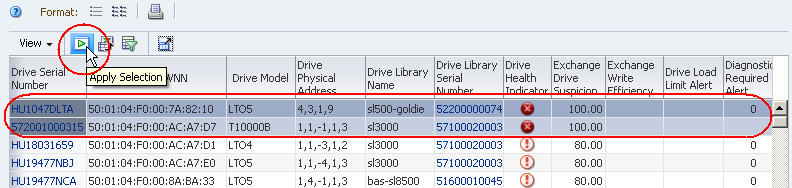
Description of the illustration ''exp_drvapplytogr.jpg''
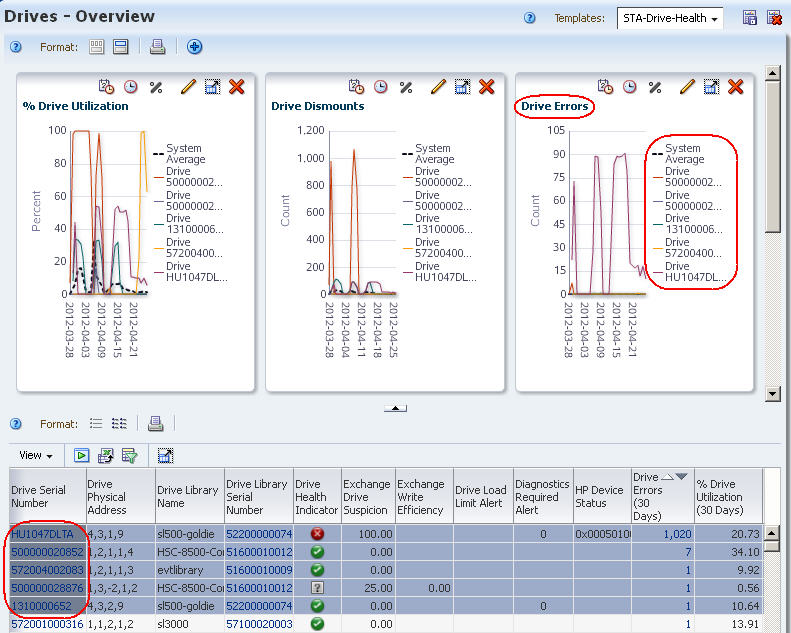
The graphs are updated with the drive data. In the example below, one of the drives shows a high level of errors when compared with the system average.
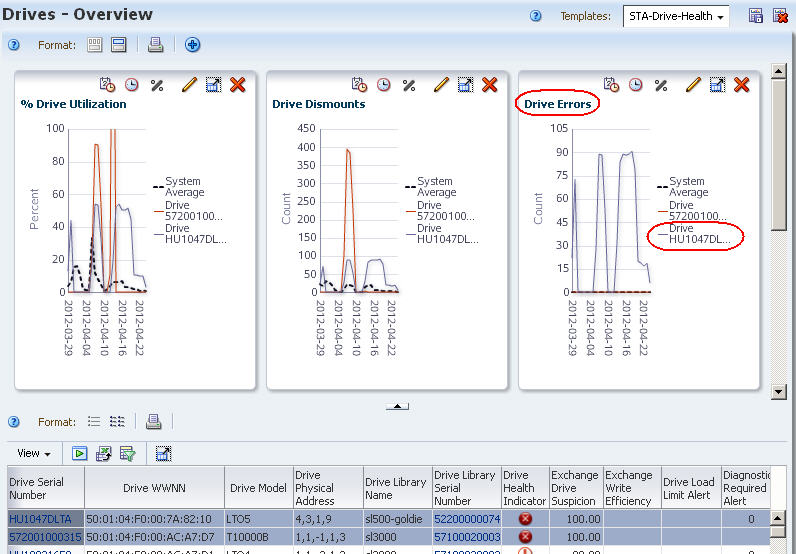
Description of the illustration ''exp_drvhierrors.jpg''
-
Report Media With the Most Errors
-
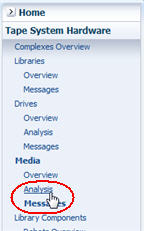
In the Navigation Bar, select Tape System Hardware, then select Media Overview.
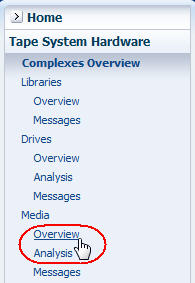
Description of the illustration ''exp_navmedovw.jpg''
-
In the Templates menu, apply the "STA-Media-Health" template.
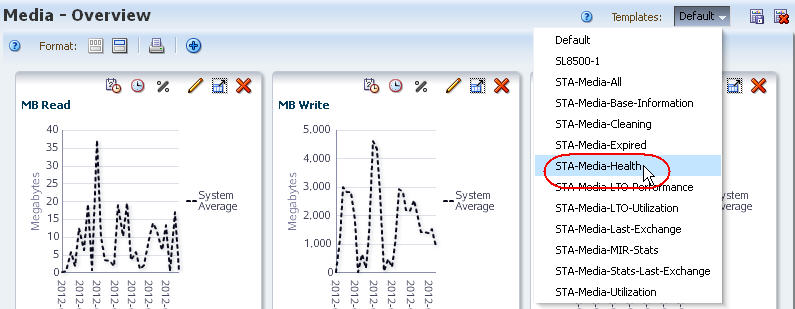
Description of the illustration ''exp_tmpmedhealth.jpg''
-
In the Dismounts With Errors (30 Days) column, click the Sort Descending arrow.
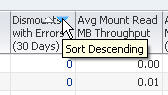
Description of the illustration ''exp_medsortdismerr.jpg''
The media with the most errors are brought to the top of the list.
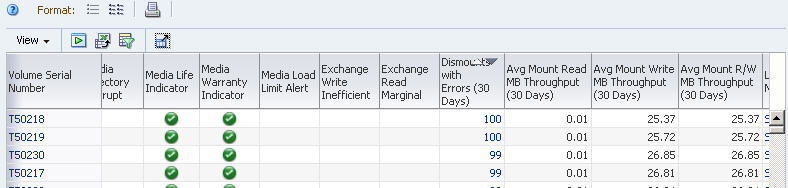
Description of the illustration ''exp_mederrorsmost.jpg''
-
Use the following steps to add selected media to the graphs.
Adding the media to the graphs allows you to easily compare their attribute values against the system average. By default, graphs always include the system average.
-
In the List View table, select the media you want to add to the graphs.
-
Click Apply Selection on the Table Toolbar.
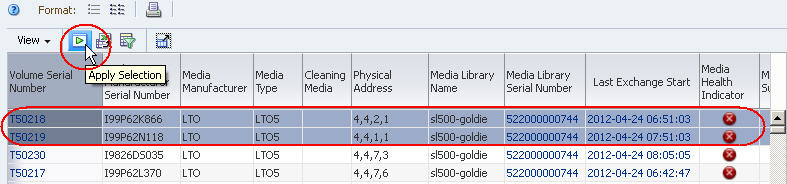
Description of the illustration ''exp_medapplytogr.jpg''
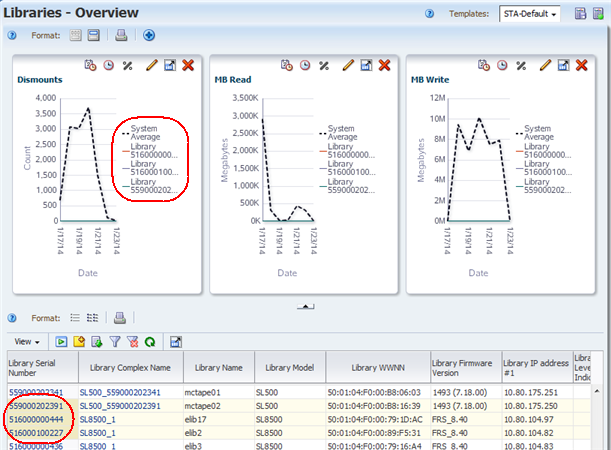
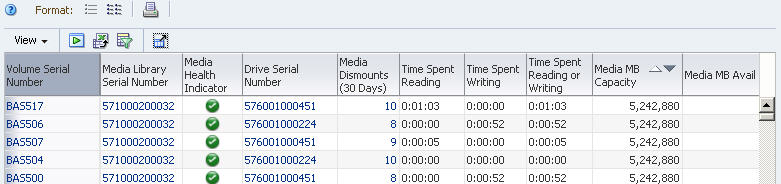
The graphs are updated with the media data. In the example below, both media show high numbers of errors when compared with the system average.
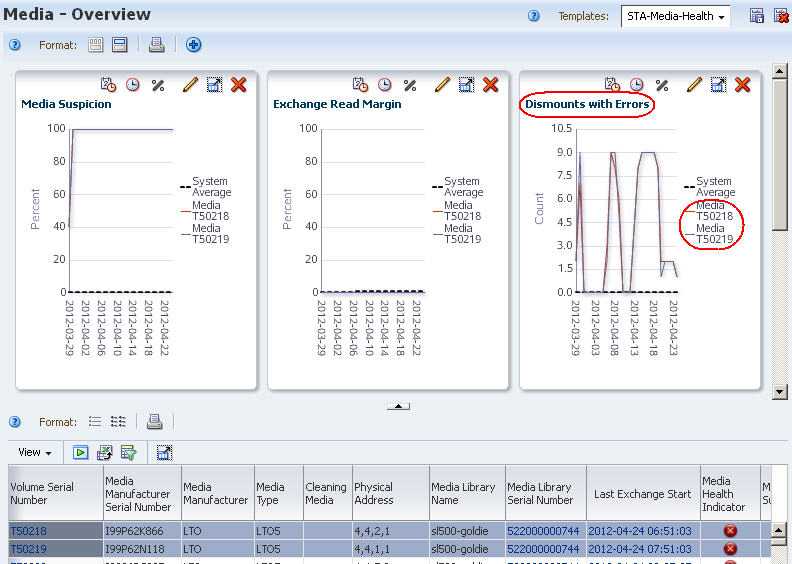
Description of the illustration ''exp_medhierrors.jpg''
-
Display Correlations Between the Two
This procedure helps you to determine whether there are correlations between the drives and media with most errors. The Exchanges Overview screen is the most useful for this activity because each exchange involves exactly one drive and one piece of media.
-
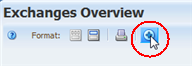
In the Navigation Bar, select Tape System Activity, then select Exchanges Overview.
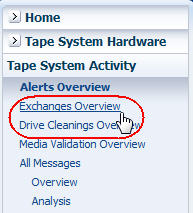
Description of the illustration ''exp_navlibexch.jpg''
-
Use the following steps to display only those exchanges that took place within the last 30 days and that involve the drive with the most errors.
The drive with the most errors was identified in "Report Drives With the Most Errors".
-
Click Filter Data.
-
In the Filter Matching field, select Match ALL entered criteria.
-
Add the following filter criteria:
-
Exchange Start (Dates) is after a date 30 days ago
-
Drive Serial Number is the serial number of the drive with the most errors
-
-
Click Apply.
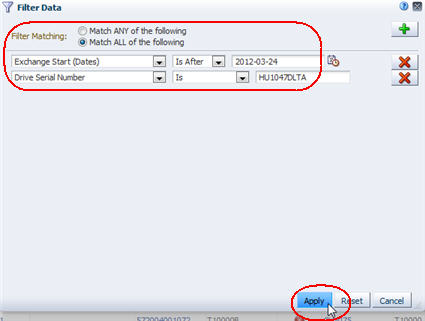
Description of the illustration ''exp_filterbaddrv.jpg''
The table is updated according to your selection criteria.
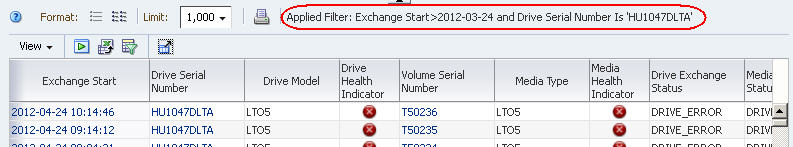
Description of the illustration ''exp_filterbaddrvdone.jpg''
-
-
To focus on the media involved in the errors, sort the table by a related column.
Suggested columns are Media Exchange Status, Exchange FSC, or Media Health Indicator.
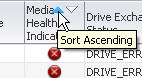
Description of the illustration ''exp_medhealthsort.jpg''
-
Visually scan the Volume Serial Number field to see if there are any correlations between drive errors and specific media.
-
If you do find a potential correlation, use the following steps to filter the data further to display just the exchanges that involve both the faulty drive and the suspect media.
-
Click Filter Data.
The selection criteria already in effect are displayed in the Filter Data dialog box.
-
Leave the current criteria rows as is, and add the following row:
-
Volume Serial Number is the volser of the suspect media identified in Step 4.
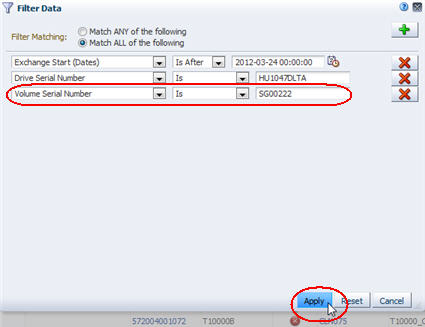
Description of the illustration ''exp_filterbaddrvvolser.jpg''
-
-
Click Apply.
The table is updated according to your selection criteria.
-
Report Trends in Drive Error Rates
This procedure addresses the questions, "Which drives have had the most errors this week? Have their error rates gone up?"
Although STA screens show 30 days worth of data by default, you can use filter and selection criteria to narrow down to just the current week. The following methods are described:
Referenced Tasks
-
STA Screen Basics Guide, to sort by a column
-
STA Screen Basics Guide, to apply library resources to graphs
-
STA Screen Basics Guide, to change a date range
-
STA Screen Basics Guide, to move a column
-
STA Screen Basics Guide, to hide and reveal columns
Using the Drives – Overview Screen
-
In the Navigation Bar, select Tape System Hardware, then select Drives Overview.
Description of the illustration ''exp_navdrvovw.jpg''
-
In the Templates menu, apply the "STA-Drive-Health" template.
Description of the illustration ''exp_tmptdrvhealth.jpg''
running 30-day sum of drive errors is shown in the table and one of the graph panes.
-
In the Drive Errors (30 Days) column, click the Sort Descending arrow.
Description of the illustration ''exp_drverrorssort.jpg''
The drives with the most errors are brought to the top of the list.
-
Use the following steps to add the top five drives to the screen graphs.
-
In the List View table, select the top five drives.
-
Click Apply Selection on the List View Toolbar.
Description of the illustration ''exp_drvovwerror.jpg''
All graphs, including Drive Errors, are updated to show these drives over a 30-day period.
Description of the illustration ''exp_drverraddtogr.jpg''
-
-
Use the following steps to narrow down the date range on the Drive Errors graph pane.
-
Click Choose Date Range on the Drive Errors Graph Pane Toolbar.
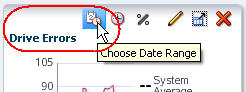
Description of the illustration ''exp_drvdaterange.jpg''
-
Complete the Choose Date Range dialog box as follows:
-
Select Time Range.
-
In the Starting Date and Ending Date fields, enter the start and end dates of the current week.
-
-
Click OK.
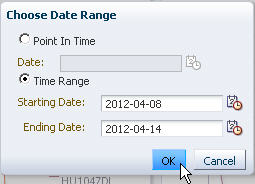
Description of the illustration ''exp_drvchoosedate.jpg''
The graph is updated according to your selection criteria. The variations in the graph lines show increases and decreases in error rates during the week.
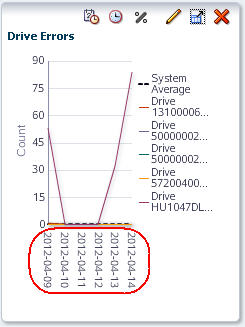
Description of the illustration ''exp_drverrnewdates.jpg''
-
Using the Exchanges Overview Screen
-
In the Navigation Bar, select Tape System Activity, then select Exchanges Overview.
Description of the illustration ''exp_navlibexch.jpg''
-
In the Templates menu, apply the "STA-Exchange-Alerts-Errors" template.
This template applies a filter to show only exchanges with errors.
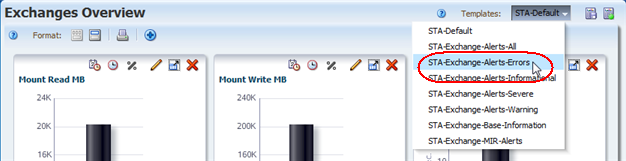
Description of the illustration ''exp_exchtmpterrors.png''
-
In the Drive Serial Number column, click the Sort Ascending or Sort Descending arrow.
Errors are grouped by drive, allowing you to bring focus to faulty drives.
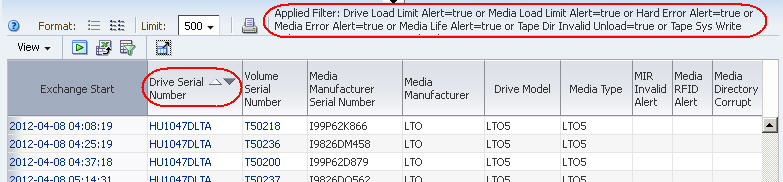
Description of the illustration ''exp_excherrorsort.jpg''
-
To focus on specific errors, use the following tasks to move columns around and remove empty columns, as applicable.
-
STA Screen Basics Guide, to move a column
-
STA Screen Basics Guide, to hide and reveal columns
-
-
Use the following steps to display just this week's data.
-
Click Filter Data.
-
In the Filter Matching field, select Match ALL entered criteria.
-
Add the following selection criteria:
-
Exchange Start (No. Days) is less than 7 days ago
-
-
Click Apply.
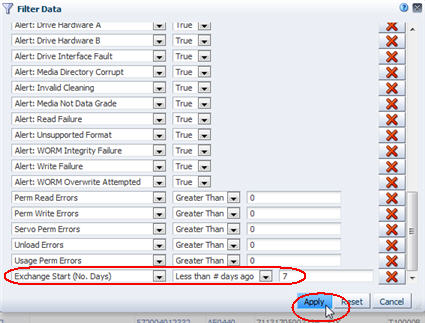
Description of the illustration ''exp_exchfilteroneweek.jpg''
The table is updated according to your selection criteria.
-
Using the Drives – Messages Screen
Since most messages do not contain a specific drive reference, the information from this method is not as comprehensive as from the others. However, this method does provide a quick snapshot of drives whose health state has changed.
-
In the Navigation Bar, select Tape System Hardware, then select Drives Messages.
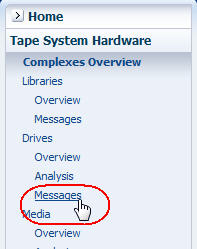
Description of the illustration ''exp_navdrvmsg.jpg''
-
In the Device Serial Number column, click the Sort Ascending or Sort Descending arrow.
Errors and statuses are grouped by drive.
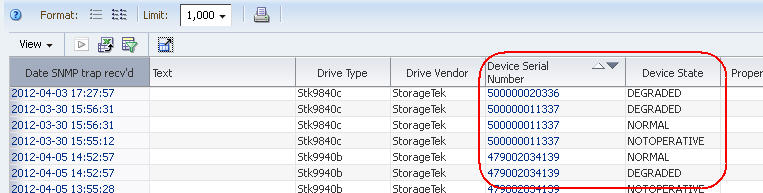
Description of the illustration ''exp_notifsortsn.jpg''
-
Visually scan the list for changes in the device state of individual drives.
Report Drive Efficiency Trends
This procedure addresses the question, "Which drives have had significantly declining efficiency over time?"
STA records and displays many measures of data transfer rate efficiency, including read, write, and read/write combined rates. STA collects the rates per exchange and then summarizes them into daily and 30-day time periods. In addition, some drive types also provide their own efficiency calculations. Following are some efficiency attributes reported by STA.
Referenced Tasks
-
STA Screen Basics Guide, to add a graph pane
-
STA Screen Basics Guide, to change the graphed attribute
-
STA Screen Basics Guide, to apply library resources to graphs
-
In the Navigation Bar, select Tape System Hardware, then select Drives Overview.
Description of the illustration ''exp_navdrvovw.jpg''
-
In the Templates menu, apply the "STA-Drive-Performance-30-Days" template.
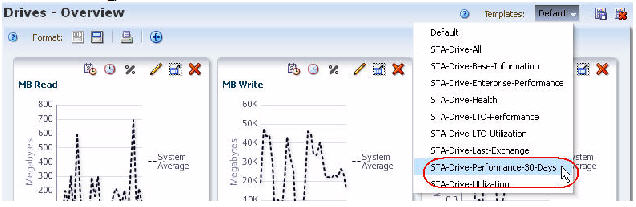
Description of the illustration ''exp_tmptdrvperf30days.jpg''
This template includes attributes related to drive performance. It does not include any graph panes.
Note:
Some measures are null or zero if STA has not been monitoring a drive long enough to gather data and calculate accurate numeric values.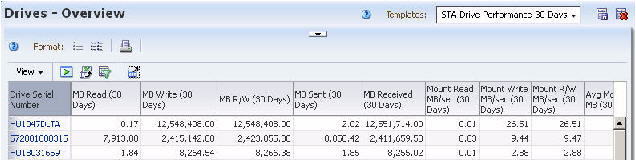
Description of the illustration ''exp_tmptdrvperf30daysd.jpg''
-
Use the following steps to add graphs of interest to the Graph Area.
By graphing selected attributes, you can see increases or decreases in efficiency over time, and compare individual drive efficiency numbers to the system average.
-
Click Restore Pane at the top of the screen to display the Graphics Area.
The Graphics Area is blank.
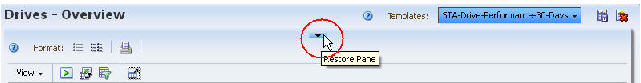
Description of the illustration ''exp_drvovwrestorepane.jpg''
-
Click Add Graph in the Graphics Area Toolbar.
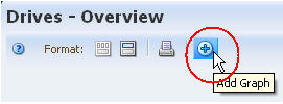
Description of the illustration ''exp_drvovwaddgraph.jpg''
A new graph pane, with the attribute MB Read, is added to the Graphics Area display.
-
Click Change Graphed Attribute in the Graph Pane Toolbar, and select an attribute of interest.
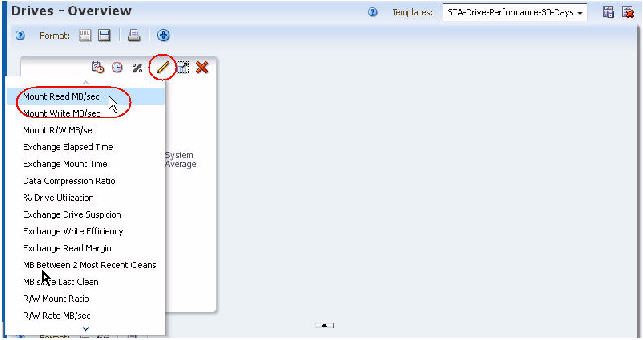
Description of the illustration ''exp_drvovwmbsec.jpg''
-
Repeat the previous two steps for any additional attributes you want to graph.
The graphs are updated to display the system average for the attributes you have selected. The examples below show Mount Read MB/sec, Mount Write MB/sec, and Mount R/W MB/sec.
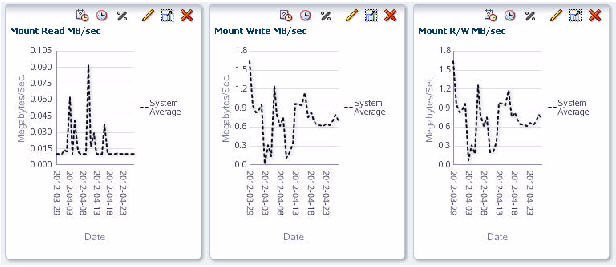
Description of the illustration ''exp_drvovwmountxmps.jpg''
-
-
Use the following steps to add the top five drives to the graphs.
Adding the drives to the graphs allows you to compare their attribute values against the system average. By default, graphs always include the system average.
-
In the List View table, select the top five drives.
-
Click Apply Selection on the Table Toolbar.
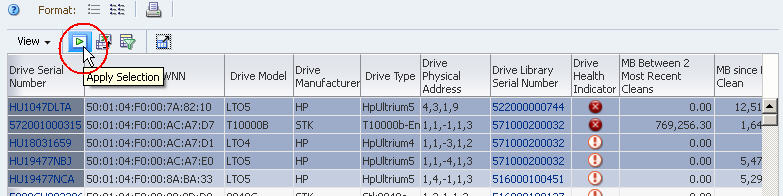
Description of the illustration ''exp_drvperfapplytogr.jpg''
The drives are added to all the screen graphs.
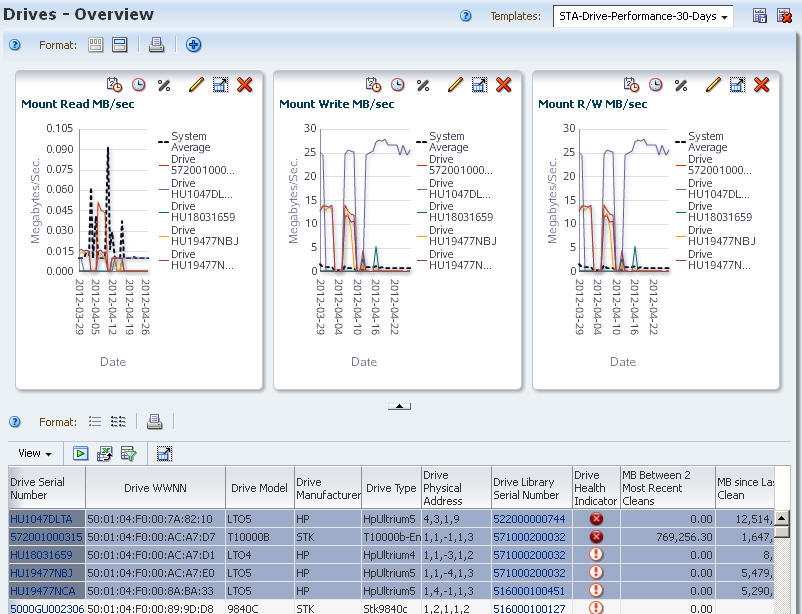
Description of the illustration ''exp_drvperfapplgrdone.jpg''
-
Report Trends in Drive Failures
This procedure addresses the question, "Is the drive that failed twice today the same one that caused problems two months ago?"
If the drive errors appear in the Messages or Exchanges tables, you can filter the tables by drive ID and then look at current and historical data. The Exchanges table, in particular, allows you to select data for a specific time period.
Referenced Tasks
-
STA Screen Basics Guide, to collapse and restore the Graphics Area
-
In the Navigation Bar, select Tape System Activity, then select Exchanges Overview.
Description of the illustration ''exp_navlibexch.jpg''
-
To view more of the table data at once, click the Collapse Pane icon in the middle of the screen to expand the table vertically.
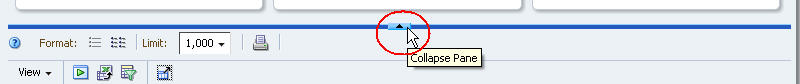
Description of the illustration ''exp_collapsepane.jpg''
-
Use the following steps to narrow down the data to exchanges that occurred between four and five months ago involving the suspect drive.
-
Click Filter Data.
-
In the Filter Matching field, select Match ALL entered criteria.
-
Add the following selection criteria:
-
Exchange Start (Dates) is after a date three months ago
-
Exchange End (Dates) is before a date two months ago
-
Drive Serial Number is the serial number of the drive with errors
Note:
If your site has exchanges that last more than a day, you may need to adjust your date settings to encompass complete exchanges involving the drive in question. -
-
Click Apply.
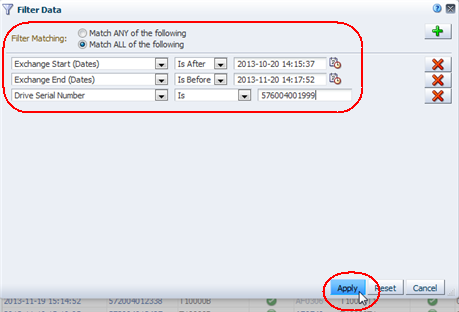
Description of the illustration ''exp_exchfilterdrv.png''
The table is updated according to your selection criteria.
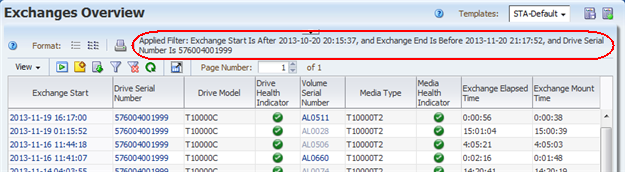
Description of the illustration ''exp_exchdrverrors.png''
-
-
Visually scan the data to determine whether the drive experienced exchanges with errors during this period.
Report Information to Help Troubleshoot Tape Job Errors
This procedure addresses the questions, "At 9:00 am today, one of our tape jobs experienced an error. Which drive and media were involved? Have they also experienced other errors?"
The following methods are described:
Referenced Tasks
-
STA Screen Basics Guide, to collapse and restore the Graphics Area
-
STA Screen Basics Guide, to navigate using links
Using the Exchanges Overview Screen
In cases where each "job" is an independent exchange (that is, mount, read/write data, dismount), you can use this method to access information about tape job failures.
-
In the Navigation Bar, select Tape System Activity, then select Exchanges Overview.
Description of the illustration ''exp_navlibexch.jpg''
-
So you can view more of the table data at once, click the Collapse Pane icon in the middle of the screen to expand the table vertically.
Description of the illustration ''exp_collapsepane.jpg''
-
Use the following steps to narrow down the data to just exchanges that experienced errors.
-
Click Filter Data.
-
In the Filter Matching field, select Match ANY entered criteria.
-
Add the following selection criteria:
-
Drive Exchange Status contains "ERROR"
-
Media Exchange Status contains "ERROR"
Note:
Entries are not case-sensitive, so "ERROR" will match "error" or "Error". -
-
Click Apply.
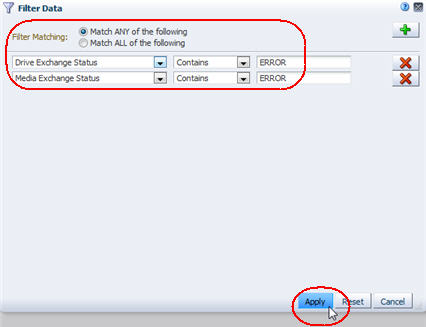
Description of the illustration ''exp_exchfiltererror.jpg''
The table is updated according to your selection criteria.
Note:
The Drive Health Indicator and Media Health Indicator columns may indicate Use even after an error. This is because the values of these attributes are aggregated over time. The specific values depend on the frequency and severity of errors, and whether there have been subsequent exchanges with no problems. Recent exchanges with no problems move the aggregated value toward a "Use" status.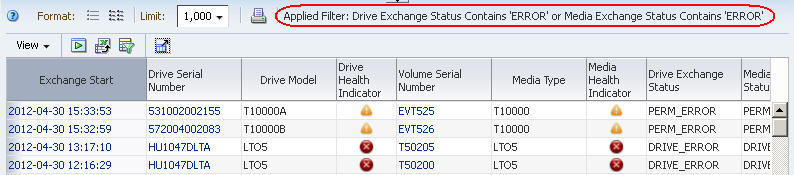
Description of the illustration ''exp_exchfilterrordone.jpg''
-
-
Scroll to exchanges that occurred around 9:00 am today, and review the information in the Drive Exchange Status, Media Exchange Status, and Exchange FSC columns for details about the errors.
By default, the rows of the table are sorted by Exchange Start time.
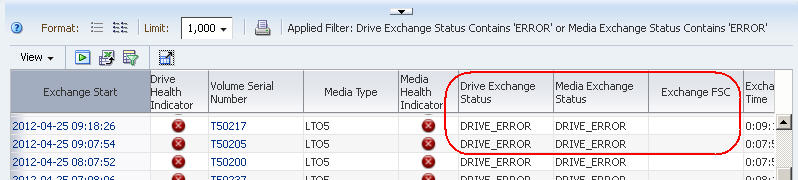
Description of the illustration ''exp_excherrorreview.jpg''
-
Optionally, to display detail about a drive or media involved in an error, select the text link in either the Drive Serial Number or Volume Serial Number column.
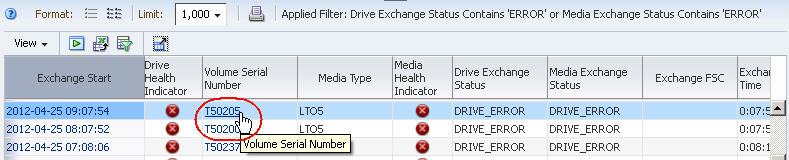
Description of the illustration ''exp_exchvsnselect.jpg''
Using the All Messages – Overview Screen
In cases where you know the time of a job failure, you can use this method to check for related STA error messages.
-
In the Navigation Bar, select Tape System Activity, then select All Messages Overview.
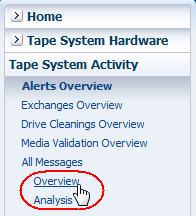
Description of the illustration ''exp_navallmsgovw.jpg''
-
Use the following steps to narrow down the data to just traps that involved errors.
-
Click Filter Data.
-
-
Severity is error
-
-
Click Apply.
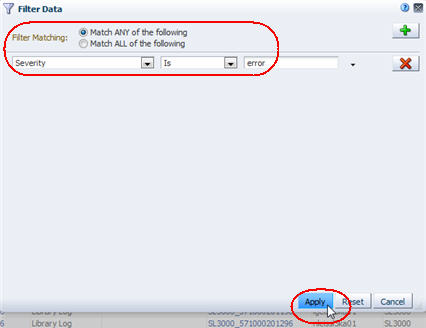
Description of the illustration ''exp_notiffiltererrortoday.jpg''
The table is updated according to your selection criteria.
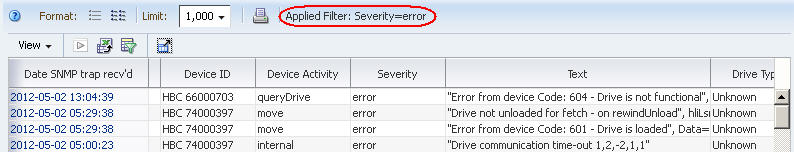
Description of the illustration ''exp_notiffilterrtodaydone.jpg''
-
-
Scroll to traps that were received around 9:00 am today, and review the entries.
By default, the rows of the table are sorted by Date SNMP trap recv'd time.
Report Trends in Critical Errors
This procedure addresses the questions, "What critical errors were reported to STA last month? Is the total number trending up, down, or staying stable?"
STA reports instances of a wide variety of error types. This procedure provides instructions for exporting the error data to a spreadsheet application, which can then be used to summarize error trends over time.
The following methods are described:
Referenced Tasks
-
STA Screen Basics Guide, to move a column
-
STA Screen Basics Guide, for information on tooltips
-
STA Screen Basics Guide, to change the width of a column
-
STA Screen Basics Guide, to export table data
-
STA Screen Basics Guide, to collapse and restore the Graphics Area
-
STA Screen Basics Guide, to add a graph pane
-
STA Screen Basics Guide, to change the graphed attribute
Using the All Messages – Overview Screen
-
In the Navigation Bar, select Tape System Activity, then select All Messages Overview.
Description of the illustration ''exp_navallmsgovw.jpg''
-
Use the following steps to narrow down the data to traps sent within the last month.
-
Click Filter Data.
-
In the Filter Matching field, select Match ALL entered criteria.
-
Add the following selection criteria:
-
Date SNMP trap recv'd (Dates) is after a date one month ago
-
Severity is error
-
-
Click Apply.
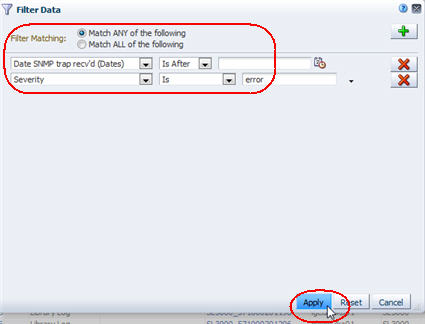
Description of the illustration ''exp_notiffiltererror.jpg''
The table is updated according to your selection criteria. The Severity and Text columns are adjacent, allowing you to review them together. You may need to scroll to the right to see the columns.
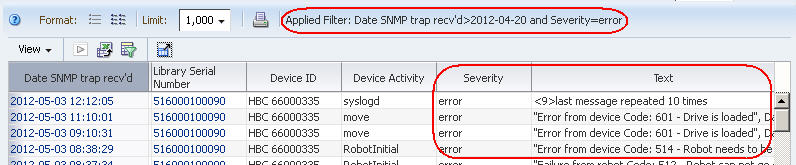
Description of the illustration ''exp_notiferrorlist.jpg''
-
-
You can use any of the following methods to see the full error message text.
-
Move the mouse over the bottom border of the cell; the full text is displayed in a tooltip.
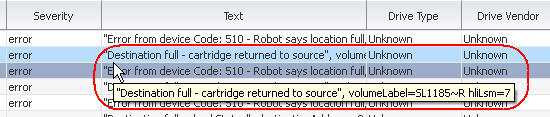
Description of the illustration ''exp_notiferrortooltip.jpg''
-
Widen the Text column.
-
Export the table to a file. Then use a compatible spreadsheet application to open the file and format the error message text so it wraps within the table column.
-
Using the Exchanges Overview Screen
Drive and media errors are reported as a result of exchanges. Therefore, it is more efficient to look for errors on the Exchanges Overview screen, where drive and media data is consolidated, rather than on the Drives or Media screens.
-
In the Navigation Bar, select Tape System Activity, then select Exchanges Overview.
Description of the illustration ''exp_navlibexch.jpg''
-
In the Templates menu, apply the "STA-Exchanges-Alerts-All" template (alternatively, apply the "STA-Exchanges-Alerts-Errors" template for a smaller subset).
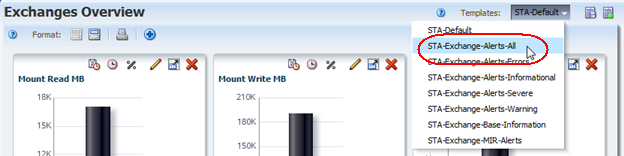
Description of the illustration ''exp_tmpexchalerts.png''
This template includes several columns that indicate different types of errors. The exchanges are sorted in reverse chronological order, — most recent exchanges first — allowing you to see at a glance which error types have predominated at your site over the last month.
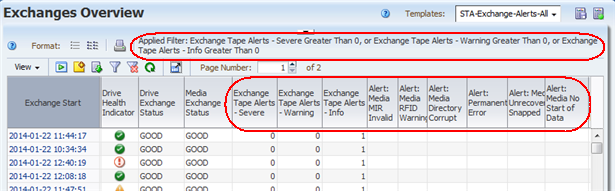
Description of the illustration ''exp_tmpexchalertsdone2.png''
-
If there are enough errors to indicate possible trends, use the following steps to add graphs of interest to the Graph Area.
Attributes that may correlate to errors include Write Efficiency, Read Margin, and R/W Rate MB/sec.
-
Click the Restore Pane icon at the top of the screen to display the Graphics Area.
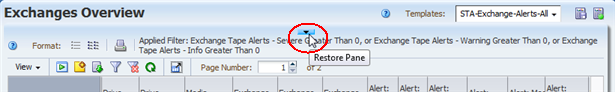
Description of the illustration ''exp_exchovwrestorepane.png''
The Graphics Area is blank.
-
Click the Add Graph icon in the Graphics Area Toolbar.
Description of the illustration ''exp_addgraph.png''
A new graph pane, with the attribute Mount Read MB, is added to the Graphics Area display.
-
Click the Change Graphed Attribute icon in the Graph Pane Toolbar, and select an attribute you want to graph.
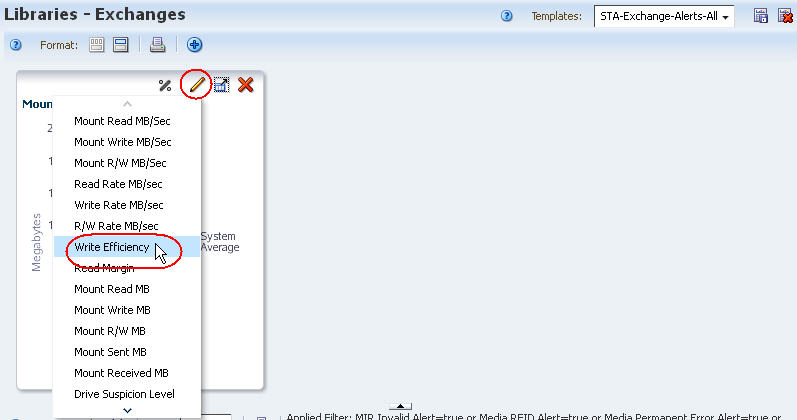
Description of the illustration ''exp_exchchggrattrib.jpg''
-
Repeat the previous two steps for any additional attributes you want to graph.
The graphs are updated to display the system average for the attributes you have selected. The samples below show Write Efficiency, Read Margin, and R/W Rate MB/sec.
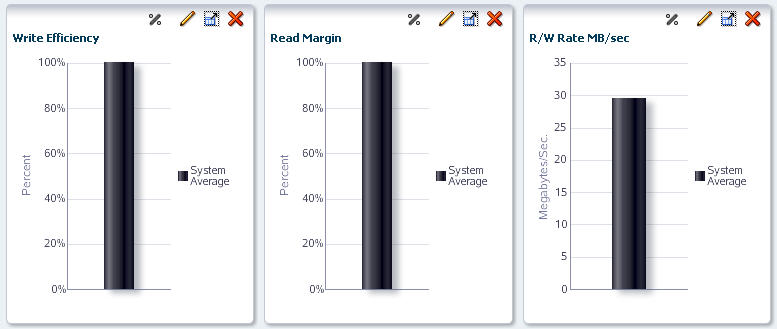
Description of the illustration ''exp_exchaddedgrs.jpg''
-
-
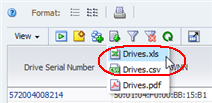
To calculate total errors by error type, you must use an external spreadsheet application. Use the following steps to export the data displayed in the table to an HTML-based Excel-compatible file.
-
Click the Export icon in the Table Toolbar and select Exchange.xls.
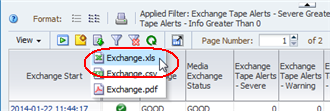
Description of the illustration ''exp_exchexport.png''
-
Save the file to a location on your local computer.
-
Use a compatible spreadsheet application to open the file and summarize the data.
-
Capacity and Resource Management Questions
| Question | Task |
|---|---|
| How many libraries, drives, or media are in my tape system environment? | "Report Total Libraries, Drives, or Media" |
| How many drives or media of a particular type are in my tape system environment? | "Report Drive and Media Types" |
| Which are the top three drives in terms of utilization? | "Report Drives With the Highest Utilization" |
| Which types of media are in short supply? Do I have an oversupply of any type? | "Report Shortages or Surpluses of Media" |
| Am I likely to need more media, drives, or storage cells next year? If so, how many? | "Project Future Media, Drive, or Storage Cell Requirements" |
| Which types of drives or media are used the most in my tape system? | "Report Resources With the Highest Utilization" |
| Which library in my tape environment is the busiest? Which is the least busy? | "Report Library Relative Activity Levels" |
| Which media are over 90 percent full? How do I generate a list that can be used to create a script to eject them from the library? | "Report Media Approaching Capacity" |
| Have all my drives been upgraded to the latest firmware? | "Report Drive Firmware Levels" |
Report Total Libraries, Drives, or Media
These procedures address the question, "How many libraries, drives, or media are in my tape system environment?"
The following methods are described:
Using the Dashboard
-
In the Navigation Bar, select Home, then select Dashboard.
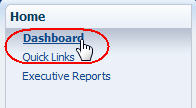
Description of the illustration ''exp_navdash.jpg''
-
If the number of resources (libraries, drives, or media) is small, you can do a quick visual count just by reading the graph.
In the sample below, you can estimate from the graph that there are ten libraries total: (8 +2).
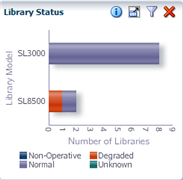
Description of the illustration ''exp_dashlibhealth.png''
-
If the number of resources is high, you can move the mouse over each slice in the pie chart to display tooltips of descriptive information, including totals.
In the sample below, the pie chart tooltips yield the count: 13 + 9 +23 =45 total.
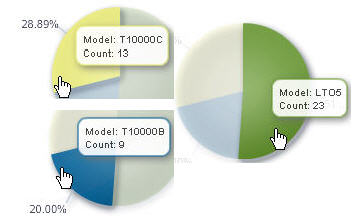
Description of the illustration ''exp_dashdrives.jpg''
Using Overview Screens
In Overview screens, the total number of records displayed is listed at the lower-right corner of the List View table. As long as there are no filters applied, this number is the total of that type of resource (libraries, drives, or media) monitored by STA.
-
In the Navigation Bar, select an Overview screen.
Description of the illustration ''exp_navdrvovw.jpg''
-
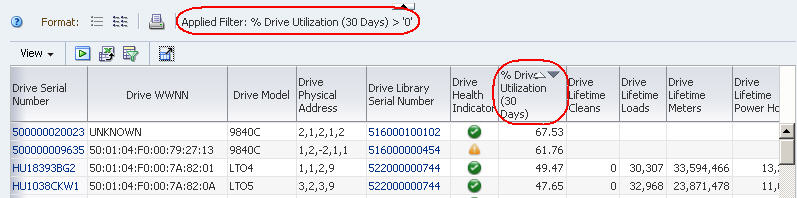
Check the Applied Filter area of the table, and verify that there is no filter in effect. If one has been applied, see "Clear the Current Filter" for instructions on clearing it.
In the sample below, no filter has been applied, and the Drives – Overview screen indicates there are 232 total drives monitored by STA.
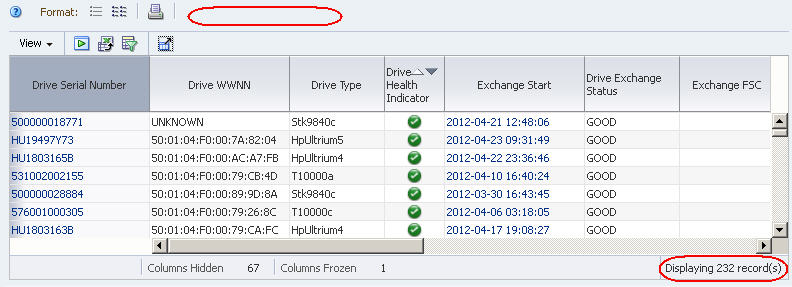
Description of the illustration ''exp_totaldrives.jpg''
Using Analysis Screens
Analysis screens aggregate data according to a variety of criteria.
-
In the Navigation Bar, select an Analysis screen.
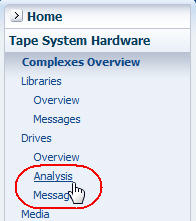
Description of the illustration ''exp_navdrvanlys.jpg''
-
Check the Applied Filter area of the table, and verify that there is no filter in effect. If one has been applied, see "Clear the Current Filter" for instructions on clearing it.
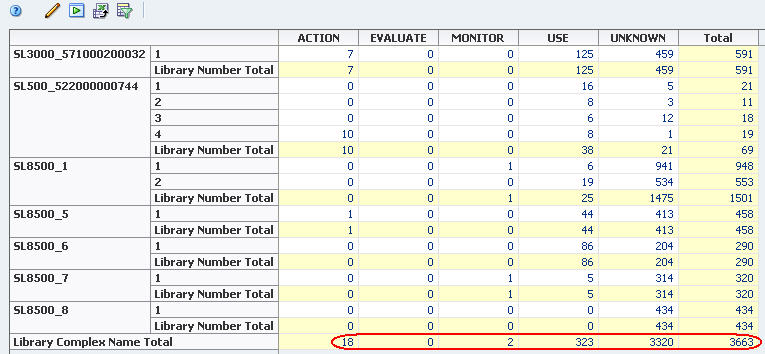
In the sample Drives – Analysis screen below, no filter has been applied, and the pivot table breaks down the 232 total drives by library complex and state.
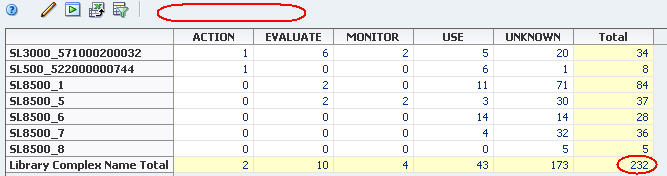
Description of the illustration ''exp_totaldrivesanlys.jpg''
Report Drive and Media Types
These procedures address the question, "How many drives or media of a particular type are in my tape system environment?"
The following methods are described:
Referenced Tasks
-
STA Screen Basics Guide, for information on tooltips
-
STA Screen Basics Guide, to navigate using links
Using the Dashboard
-
In the Navigation Bar, select Dashboard.
Description of the illustration ''exp_navdash.jpg''
-
Move the mouse over the relevant section of a pie or bar chart to display a tooltip with descriptive information and totals.
In the following sample, moving the mouse over the T10000C bar reveals there are four T10000C drives with an "Evaluate" health.
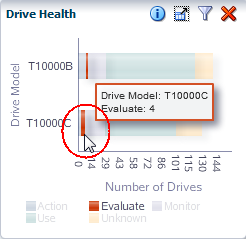
Description of the illustration ''exp_dashdrvhealth.png''
-
If you select a section of a bar or pie chart, you are taken to the associated Overview screen, filtered for that type of drive or media.
In the sample below, the Drives – Overview screen is displayed, filtered to display only T10000C drives with an "Evaluate" health.
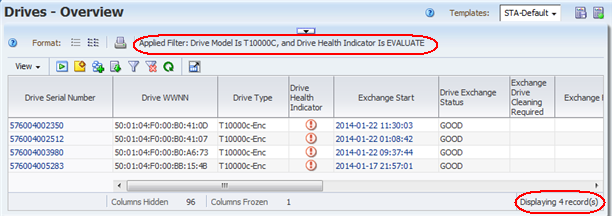
Description of the illustration ''exp_drvovwt10kc.png''
Using Analysis Screens
This method is especially useful if you want data aggregated by a series of criteria, such as by library and media state. The pivot table on Analysis screens presents this information in a concise format.
-
In the Navigation Bar, select an Analysis screen (Drives – Analysis or Media – Analysis).
Description of the illustration ''exp_navmedanlys.jpg''
In the sample Media – Analysis screen below, subtotals and totals are provided at the bottom of each column and to the right of each row.
Description of the illustration ''exp_medanlystotals.jpg''
Report Drives With the Highest Utilization
These procedures address the question, "Which are the top three drives in terms of utilization?"
Utilization can be defined in several ways, including lifetime hours in use, amount of data passed, and total number of mounts. The following methods are described:
Using Total Time in Motion
Note:
This information is provided only by StorageTek enterprise drives.-
In the Navigation Bar, select Tape System Hardware, then select Drives Overview.
Description of the illustration ''exp_navdrvovw.jpg''
-
In the Templates menu, apply the "STA-Drive-Utilization" template.
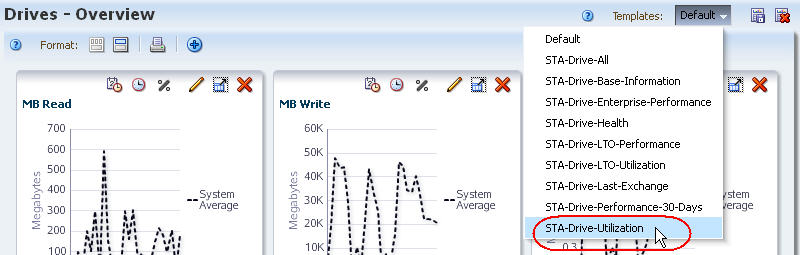
Description of the illustration ''exp_tmptdrvutil.jpg''
-
In the Drive Lifetime Hours in Motion column, click the Sort Descending arrow.
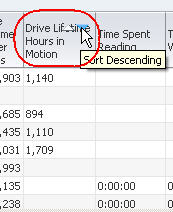
Description of the illustration ''exp_drvlifetimesort.jpg''
The top three drives in terms of time in motion are displayed at the top of the list.
Description of the illustration ''exp_drvovwlifetime.jpg''
Using Time in Use Over the Last 30 Days
-
In the Navigation Bar, select Tape System Hardware, then select Drives Overview.
Description of the illustration ''exp_navdrvovw.jpg''
-
In the Templates menu, apply the "STA-Drive-Utilization" template.
Description of the illustration ''exp_tmptdrvutil.jpg''
-
In the % Drive Utilization (30 Days) column, click the Sort Descending arrow.
Description of the illustration ''exp_drvpctutilsort.jpg''
The top three drives in terms of percentage time in use are displayed at the top of the list.
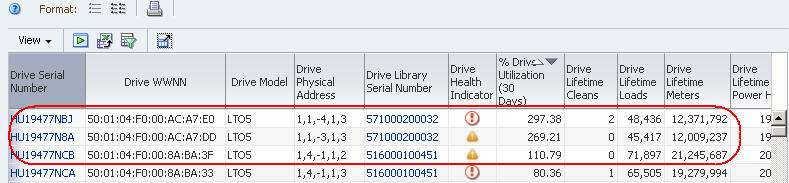
Description of the illustration ''exp_drvovwpctutil.jpg''
Report Shortages or Surpluses of Media
This procedure addresses the questions, "Which type of media am I the shortest on? Do I have an oversupply of any type?"
The definition of media available for writing varies by site. For example, a site that does not reuse media may simply compare total versus available capacity for each type of media; another site that does reuse media may look at some media life measure instead. Both of these measures, and others, are available within STA. This procedure uses total versus available capacity.
Referenced Tasks
-
STA Screen Basics Guide, to sort by multiple columns
-
STA Screen Basics Guide, to move a column
-
STA Screen Basics Guide, to export table data
-
In the Navigation Bar, select Tape System Hardware, then select Media Overview.
Description of the illustration ''exp_navmedovw.jpg''
-
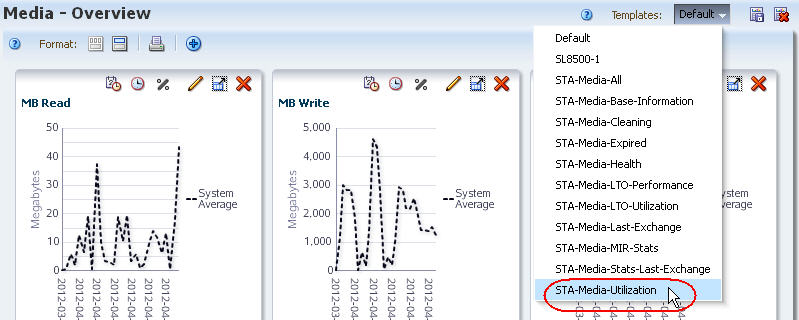
In the Templates menu, select the "STA-Media-Utilization" template.
Note:
Depending on the number of templates available to your STA username, you may need to scroll down in the menu to see the selection.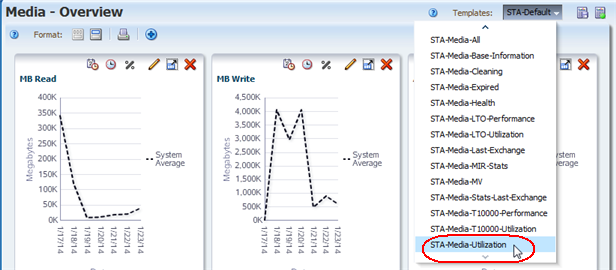
Description of the illustration ''exp_tmpmedutil.png''
This template includes all the attributes related to utilization, such as Media Dismounts (30 Days), MB Read (30 Days), and Media Life Indicator.
Description of the illustration ''exp_tmpmedutildone.png''
-
Use the following steps to eliminate any media for which capacity or availability information is not available.
The longer STA monitors the libraries, the more exchange data it receives, and the lower the overall uncertainty level.
-
Click Filter Data.
-
Add the following selection criteria:
-
Media MB Capacity is greater than 0
-
-
Click Apply.
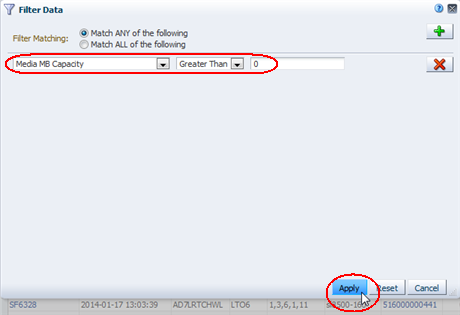
Description of the illustration ''exp_filtermedutil.png''
-
-
Note the number of records eliminated, since it reflects the level of uncertainty.
In the sample below, the number of records goes from 647 to 431, indicating a high uncertainty level. This library has been monitored for only a few days.
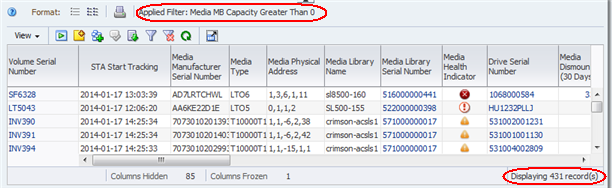
Description of the illustration ''exp_filtermedutildone.png''
-
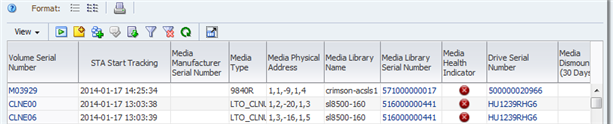
For the media in the resulting list, use the following steps to display the capacity and space available for each piece of media displayed.
-
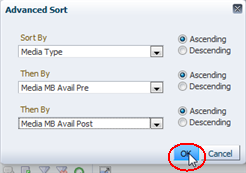
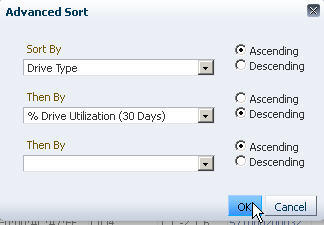
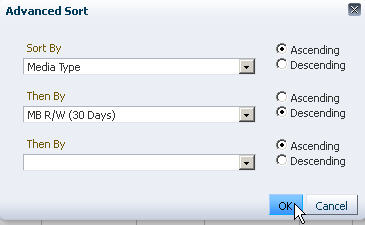
In the Table Toolbar, select View, then select Sort, then select Advanced.
-
Complete the Advanced Sort dialog box as follows:
-
In the Sort By menu, select Media Type.
-
In the first Then By menu, select Media MB Avail Pre.
-
In the next Then By menu, select Media MB Avail Post.
Note:
LTO drives report the Media MB Avail Pre attribute, and StorageTek enterprise drives report Media MB Avail Post. Including both attributes in the sort criteria ensures you will include all media types. -
-
Click OK.
Description of the illustration ''exp_medsortmbavail.png''
The table is sorted according to your criteria.
-
-
To better view the capacity data together on the screen, use the following steps to reorder the table columns.
-
In the Table Toolbar, select View, then select Reorder Columns.
-
In the Reorder Columns dialog box, arrange the following attributes so they are listed together.
-
Media Type
-
Media MB Capacity
-
Media MB Avail Pre
-
Media MB Avail Post
-
-
Click OK.
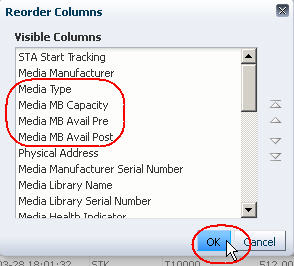
Description of the illustration ''exp_medreordercold.jpg''
The table columns are reordered according to your criteria.
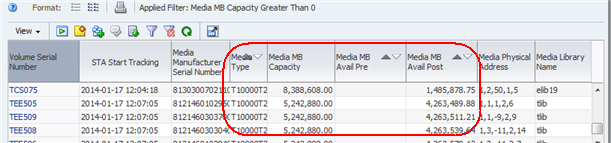
Description of the illustration ''exp_medsortmbavaildone.png''
-
-
To calculate the total capacity and space available for each media type, you must use an external spreadsheet application. Use the following steps to export the data displayed in the table to an HTML-based Excel-compatible file.
-
Click the Export icon in the Table Toolbar and select the Media.xls option.
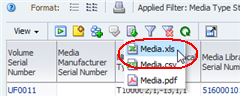
Description of the illustration ''exp_medexport.png''
-
Save the file to a location on your local computer.
-
-
Use a compatible spreadsheet application to open the file and summarize the data. For example, you may want to calculate totals, percentages used, or averages by media type.
Project Future Media, Drive, or Storage Cell Requirements
These procedures address the questions, "Am I likely to need more media, drives, or storage cells next year? If so, how many?"
The criteria for determining whether drives or media need replacement varies by site.
For drives, STA tracks many applicable criteria — in particular, several drive lifetime measures, such as Drive Lifetime Loads, Drive Lifetime Meters, and Drive Lifetime Power Hours. See "Report Percent Drive Utilization", below, for one example.
For media, STA provides data that is useful in a variety of scenarios, including the following:
-
Your site is migrating off one type of media and you need to replace it with another; see "Report Data Related to Media Migration" for details.
-
Existing media are ageing or showing errors beyond your site-defined reasonable threshold; see "Report Data Related to Media Ageing" for details.
-
Existing media are filling up; see "Report Shortages or Surpluses of Media" for details.
Referenced Tasks
-
STA Screen Basics Guide, to sort by a column
-
STA Screen Basics Guide for information on tooltips
Report Percent Drive Utilization
-
In the Navigation Bar, select Tape System Hardware, then select Drives Overview.
Description of the illustration ''exp_navdrvovw.jpg''
-
In the Templates menu, select the "STA-Drive-Utilization" template.
Description of the illustration ''exp_tmptdrvutil.jpg''
The first graph on the screen is % Drive Utilization, which displays the system average of percent drive utilization over time. This provides a high-level measure of activity for all drives in your environment.
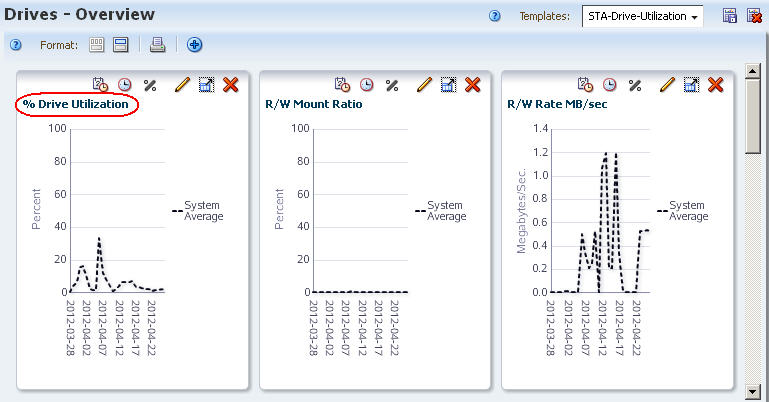
Description of the illustration ''exp_drvpctutilgr.jpg''
-
To differentiate and compare the activity levels of individual drives, and to identify potential hot spots, you can sort or filter the drives in the table by various criteria, such as drive type or library.
In the sample below, the table is sorted in descending order of % Drive Utilization (30 Days) — highest percentage utilization first.
Description of the illustration ''exp_drvpctutilsort2.jpg''
-
Use the following steps to add the top five drives to the screen graphs.
Adding the drives to the graphs allows you to compare their attribute values against the system average.
-
In the List View table, select the top five drives.
-
Click the Apply Selection icon on the List View Toolbar.
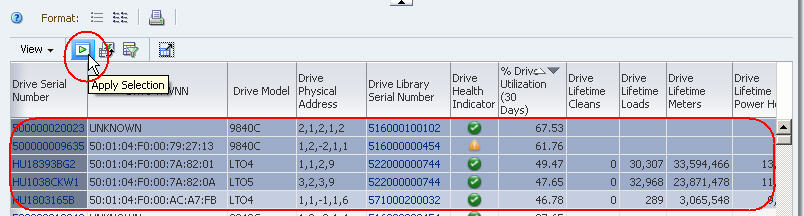
Description of the illustration ''exp_drvpctutilapplytogr.jpg''
The drives are added to the graphs.
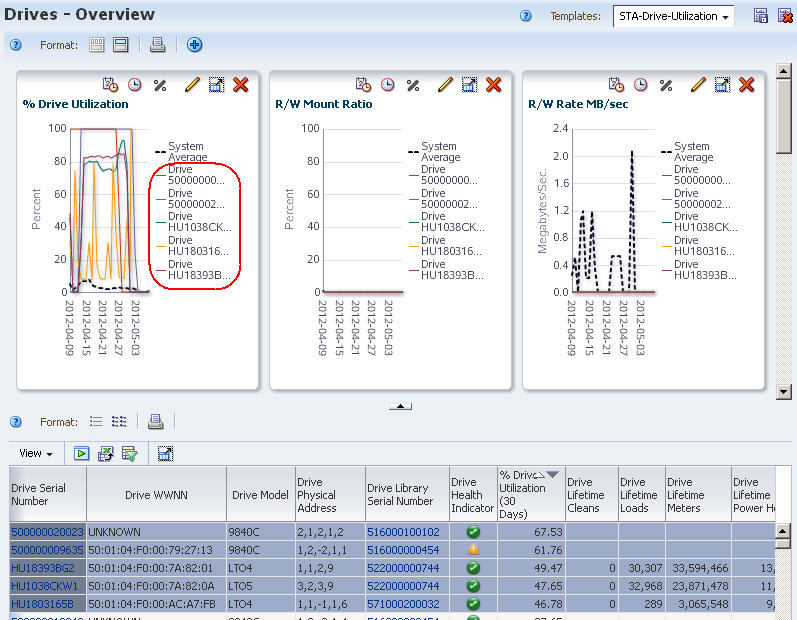
Description of the illustration ''exp_drvpctutilapplydone.jpg''
-
Report Data Related to Media Migration
-
In the Navigation Bar, select Home, then select Dashboard.
Description of the illustration ''exp_navdash.jpg''
The screen provides a high-level view of the number of media, aggregated by type.
-
Move the mouse over the Library Media Cells graph to display detail for each type of media stored in the library system.
The sample below illustrates a site planning to migrate off older generation LTO2 and LTO3 tapes. Moving the mouse over these two sections of the pie chart reveals there are a total of 27 LTO2 and 64 LTO3 media that must be replaced.
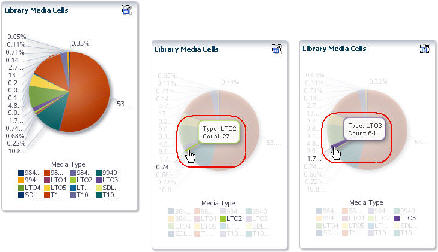
Description of the illustration ''exp_dashlibmedmigrate.jpg''
-
Select a section of the pie chart to go to the Media – Overview screen filtered for that type of media.
The sample below shows the screen filtered for LTO2 media. On this screen, you can organize the media records by remaining capacity, physical location, or other attributes pertinent to the migration process.
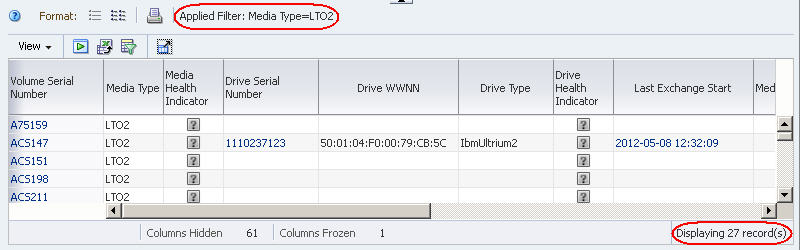
Description of the illustration ''exp_medovwlto2.jpg''
-
Alternative approaches for gathering this information are to use either of the following screens, which can summarize, filter, or aggregate media totals by type.
-
Media – Overview
-
Media – Analysis
-
Report Data Related to Media Ageing
-
In the Navigation Bar, select Tape System Hardware, then select Media Overview.
Description of the illustration ''exp_navmedovw.jpg''
-
In the Templates menu, select "STA-Media-Expired".
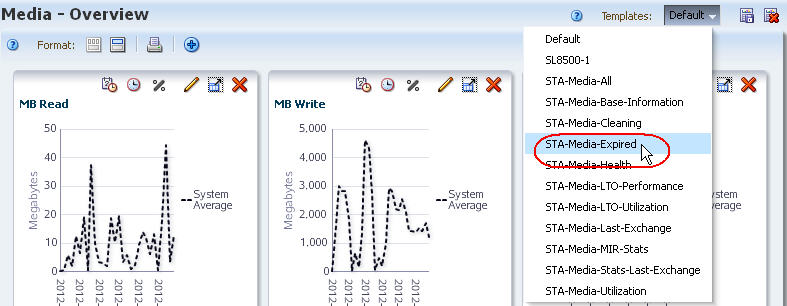
Description of the illustration ''exp_tmptmedexpired.jpg''
This template includes a filter and attributes related to media that have expired and should be retired from service.
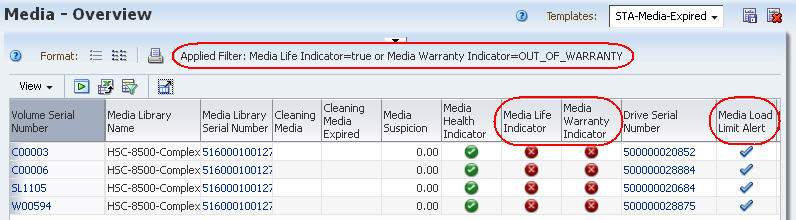
Description of the illustration ''exp_tmpmedexpireddone.jpg''
Report Resources With the Highest Utilization
This procedure addresses the question, "Which types of drives or media are used the most in my tape system?"
The drives and media that make up the majority of the system are not necessarily subject to the most use. Utilization is affected by your client configuration and the types of drives and media requested by these clients. This procedure addresses some of the most common ways of defining most used.
The following methods are described:
Referenced Tasks
-
STA Screen Basics Guide, to sort by multiple columns
-
STA Screen Basics Guide, to export table data
Report Drive Utilization
-
In the Navigation Bar, select Tape System Hardware, then select Drives Overview.
Description of the illustration ''exp_navdrvovw.jpg''
-
In the Templates menu, apply the "STA-Drive-Utilization" template.
Description of the illustration ''exp_tmptdrvutil.jpg''
This template displays utilization statistics for all drive types.
-
Use the following steps to remove drives for which STA has no utilization data.
-
Click Filter Data.
-
In the selection criteria, select the attribute that represents the utilization measure of interest to you. Select Greater than and enter 0.
Following are some suggested attributes for measuring drive utilization.
-
To identify drives with the highest utilization rates, use % Utilization (30 Days).
-
To identify drives that have recorded the most new data, use MB Write (30 Days), or MB Received (30 Days).
-
To identify drives that have passed the most data at the drive head, use MB R/W (30 Days).
-
For drives that have been in the library for their entire periods of use, the drive lifetime attributes are also useful measures of activity — for example, Drive Lifetime Loads or Drive Lifetime Hours in Motion.
-
-
Click Apply.
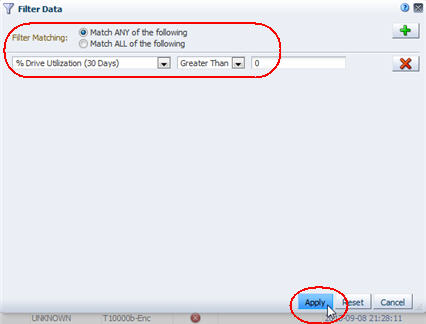
Description of the illustration ''exp_filterdrvutil.jpg''
-
-
Perform a multiple-column sort to group the records by drive type and then utilization.
-
In the Table Toolbar, select View, then select Sort, then select Advanced.
-
Complete the Advanced Sort dialog box as follows:
-
In the Sort By field, select Drive Type.
-
In the Then By field, select the attribute that you used in Step b above, and Descending.
-
-
Click OK.
Description of the illustration ''exp_drvsortpctutil.jpg''
The table is sorted according to your criteria.
-
-
To summarize the data by drive type, you must use an external spreadsheet application. Use the following steps to export the data displayed in the table to an HTML-based Excel-compatible file.
-
Click the Export icon in the Table Toolbar, and select Drives.xls.
Description of the illustration ''exp_drvexport.png''
-
Save the file to a location on your local computer.
-
-
Use a compatible spreadsheet application to open the file and summarize the data.
Report Media Utilization
-
In the Navigation Bar, select Tape System Hardware, then select Media Overview.
Description of the illustration ''exp_navmedovw.jpg''
-
In the Templates menu, apply the "STA-Media-Utilization" template.
Description of the illustration ''exp_tmpmedutil.jpg''
This template displays utilization statistics for all media types.
-
Use the following steps to remove media for which STA has no utilization data.
-
Click Filter Data.
-
In the selection criteria, select the attribute that represents the utilization measure of interest to you. Select Greater than and enter 0.
Following are some suggested attributes for measuring media utilization:
-
To identify media with the greatest amount of movement, use Time spent reading or writing.
-
To identify media below a specific threshold of available space, use Media MB Avail Pre/Post
-
To identify media with the greatest number of mounts and dismounts, use Media Dismounts (30 days).
-
To identify media with the greatest amount of data read or written, use MB R/W (30 days).
-
-
Click Apply.
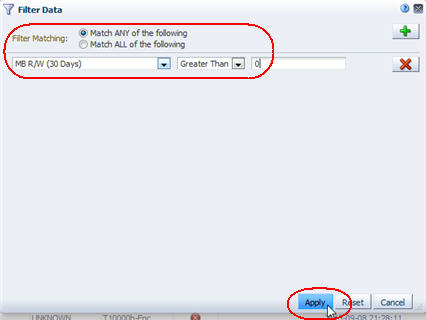
Description of the illustration ''exp_filtermedutil2.jpg''
-
-
Perform a multiple-column sort to group the records by media type and then utilization.
-
In the Table Toolbar, select View, then select Sort, then select Advanced.
-
Complete the Advanced Sort dialog box as follows:
-
In the Sort By field, select Media Type.
-
In the Then By field, select the attribute that you used in Step b above, and Descending.
-
-
Click OK.
Description of the illustration ''exp_medsortmbrw.jpg''
The table is sorted according to your criteria.
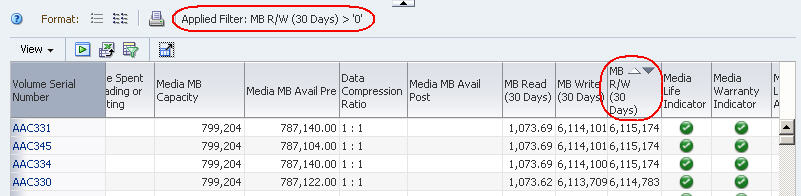
Description of the illustration ''exp_medsortmbrwdone.jpg''
-
-
To summarize the data by media type, you must use an external spreadsheet application. Use the following steps to export the data displayed in the table to an HTML-based Excel-compatible file.
-
Click the Export icon in the Table Toolbar, and select Media.xls.
Description of the illustration ''exp_medexport.png''
-
Save the file to a location on your local computer.
-
-
Use a compatible spreadsheet application to open the file and summarize the data.
Report Library Relative Activity Levels
This procedure addresses the questions, "Which library in my tape environment is the busiest? Which is the least busy?"
The definition of busy varies by site; common definitions include the number of exchanges, mounts, or dismounts. This procedure uses the number of mounts. In addition, it provides instructions for graphing the data so you can compare the libraries to one another and to the system average.
Referenced Tasks
-
STA Screen Basics Guide, to sort by a column
-
STA Screen Basics Guide, to add a graph pane
-
STA Screen Basics Guide, to change the graphed attribute
-
STA Screen Basics Guide, to apply library resources to graphs
-
STA Screen Basics Guide, to detach a graph pane
-
In the Navigation Bar, select Tape System Hardware, then select Libraries Overview.
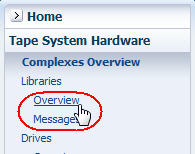
Description of the illustration ''exp_navlibovw.jpg''
-
In the Templates menu, apply the "STA-Lib-Utilization" template.
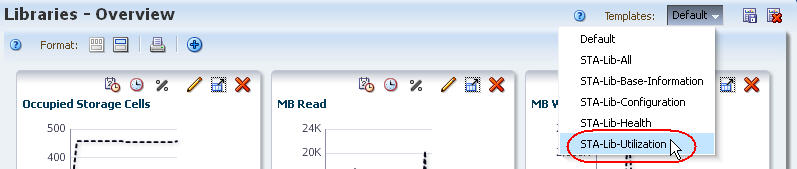
Description of the illustration ''exp_tmptlibutil.jpg''
-
In the Mounts (30 Days) column, click the Sort Ascending or Sort Descending arrow.
Note:
Other columns you might want to sort by are Enters (30 Days), Ejects (30 Days), Occupied Storage Cells, or MB R/W (30 Days).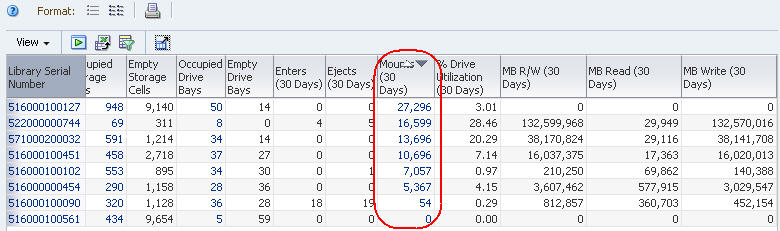
Description of the illustration ''exp_libsortmounts.jpg''
-
Use the following steps to add a graph pane showing dismounts.
-
Click the Add Graph icon in the Graphics Area Toolbar.
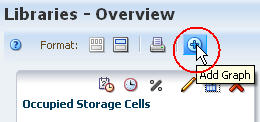
Description of the illustration ''exp_libaddgr.jpg''
A new graph pane, with the attribute MB Read, is added to the end of the Graphics Area display. You may need to scroll down to see the graph.
-
Click the Change Graphed Attribute icon in the Graph Pane Toolbar, and select the Dismounts attribute from the menu.
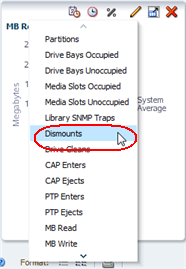
Description of the illustration ''exp_libchgdismounts.png''
The graph is updated to display the system average for dismount data.
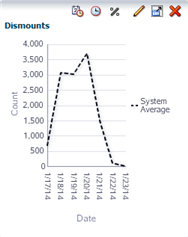
Description of the illustration ''exp_libgdismounts.png''
-
-
Use the following steps to add selected libraries to the screen graphs.
Adding the libraries to the graphs allows you to compare their attribute values against the system average.
-
In the List View table, select the libraries you want to add to the graphs.
-
Click the Apply Selection icon on the List View Toolbar.
Description of the illustration ''exp_libapply.png''
In the sample below, the three libraries with most mounts are added to all the graphs.
Description of the illustration ''exp_libaddtodismounts.png''
-
-
In the Dismounts graph pane, click the Detach Pane icon to detach the graph to enlarge it and display more detail.
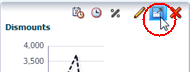
Description of the illustration ''exp_libdetgrmounts.png''
Report Media Approaching Capacity
This procedure addresses the questions, "Which media are over 90 percent full? How do I generate a list that can be used to create a script to eject them from the library?"
STA reports media capacity and available space as numeric values only, not as percentages. This procedure provides instructions for exporting the numeric values to a spreadsheet application, which can then be used to calculate percentages. The resulting list can be used by a media eject script.
Referenced Tasks
-
STA Screen Basics Guide, to sort by a column
-
STA Screen Basics Guide, to export table data
-
In the Navigation Bar, select Tape System Hardware, then select Media Overview.
Description of the illustration ''exp_navmedovw.jpg''
-
In the Templates menu, apply the "STA-Media-Utilization" template.
Description of the illustration ''exp_tmpmedutil.jpg''
This template includes the Media MB Available and Media MB Capacity attributes.
-
In the Media MB Capacity column, click the Sort Descending arrow.
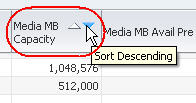
Description of the illustration ''exp_medsortcapacity.jpg''
The media with the highest capacity are brought to the top of the list. This sort also has the advantage of grouping media by type, since capacity tends to vary by media type.
Description of the illustration ''exp_medovwcapacity.jpg''
-
To create a list that can be used by a media eject script, you must use an external spreadsheet application. Use the following steps to export the data displayed in the table to an HTML-based Excel-compatible file.
-
Click the Export icon in the Table Toolbar and selected the Media.xls option.
Description of the illustration ''exp_medexport.png''
-
Save the file to a location on your local computer.
-
-
Using a compatible spreadsheet program, add a Percentage Full column, containing calculated values derived from the attributes in the exported table. Sort the table by the column values and identify a list of media over 90 percent full.
Report Drive Firmware Levels
This procedure addresses the question, "Have all my drives been upgraded to the latest firmware?" Firmware levels are usually evaluated by drive type or model.
The following methods are described:
Referenced Tasks
-
STA Screen Basics Guide, to move a column
-
STA Screen Basics Guide, to sort by multiple columns
-
STA Screen Basics Guide, to change the height of a row
-
STA Screen Basics Guide, to navigate using aggregate count links
Using the Drives – Overview Screen
-
In the Navigation Bar, select Tape System Hardware, then select Drives Overview.
Description of the illustration ''exp_navdrvovw.jpg''
-
In the Templates menu, apply the "STA-Drives-Base-Information" template.
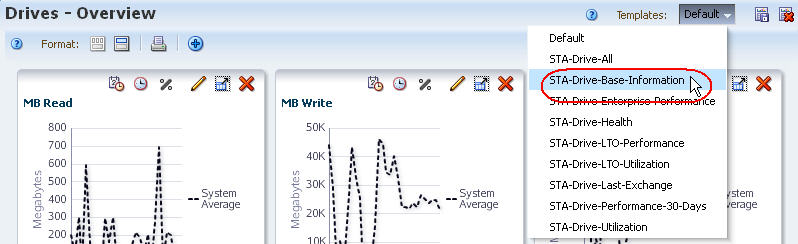
Description of the illustration ''exp_tmpdrvbase.jpg''
This template includes the drive firmware version and other related attributes.
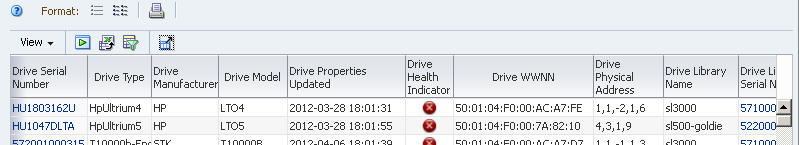
Description of the illustration ''exp_drvtmpbasedone.jpg''
-
Use the following steps to reorder the table columns so the drive firmware level is displayed next to the drive model.
-
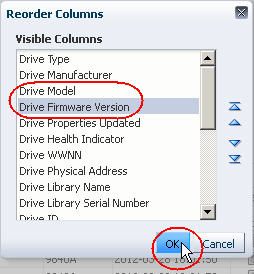
In the Table Toolbar, select View, then select Reorder Columns.
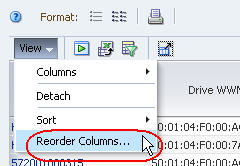
Description of the illustration ''exp_drvreordercol.jpg''
-
In the Reorder Columns dialog box, arrange the following attributes so they are listed together.
-
Drive Model
-
Drive Firmware Version
-
-
Click OK.
Description of the illustration ''exp_drvfwreordercold.jpg''
The table columns are reordered according to your criteria.
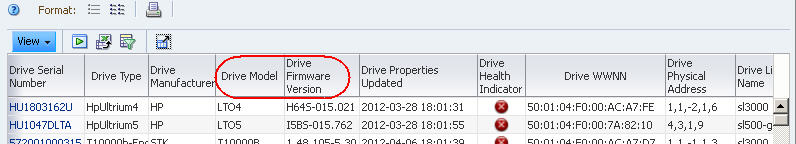
Description of the illustration ''exp_drvfwreordercoldone.jpg''
-
-
To display firmware levels by drive type, use the following steps to set up a multiple-column sort.
-
In the Table Toolbar, select View, then select Sort, then select Advanced.
-
complete the Advanced Sort dialog box as follows:
-
In the Sort By field, select Drive Model.
-
In the Then By field, select Drive Firmware Version and select Descending.
-
-
Click OK.
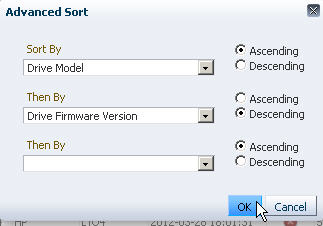
Description of the illustration ''exp_drvsortfw.jpg''
The table is sorted according to your criteria.
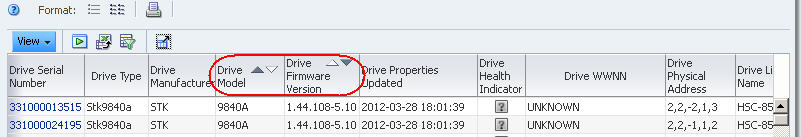
Description of the illustration ''exp_drvfwadvsortdone.jpg''
-
-
Use the following steps to display firmware levels for a specific drive model.
-
Click Filter Data.
-
Specify the following selection criteria:
-
Drive Model is the drive model of interest.
-
-
Click Apply.
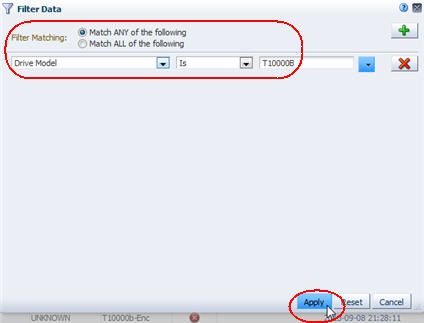
Description of the illustration ''exp_drvfwfiltermodel.jpg''
The table is updated according to your selection criteria.
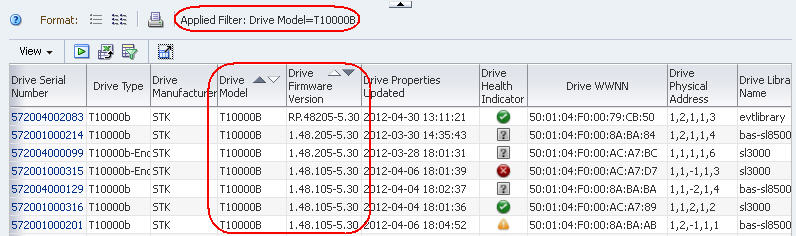
Description of the illustration ''exp_drvfwtabledone.jpg''
-
Using the Drives – Analysis Screen
This method provides totals by drive and firmware level, and aggregates the totals by library complex.
-
In the Navigation Bar, select Tape System Hardware, then select Drives Analysis.
Description of the illustration ''exp_navdrvanlys.jpg''
-
Use the following steps to display firmware levels for a specific drive model.
-
Click Filter Data.
-
Specify the following selection criteria:
-
Drive Model is the drive model of interest.
-
-
Click Apply.
Description of the illustration ''exp_drvfwfiltermodel.jpg''
The table is updated according to your selection criteria.
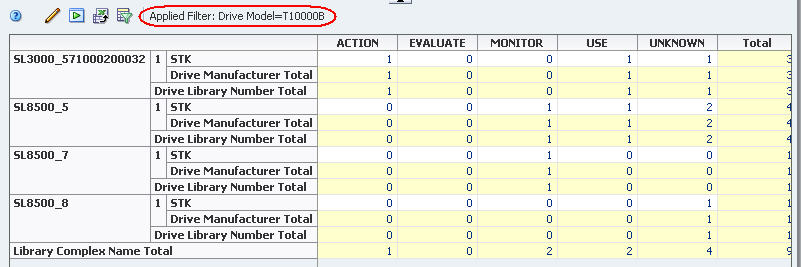
Description of the illustration ''exp_drvpivhlthbycomplex.jpg''
-
-
Use the following steps to reorganize the pivot table to aggregate firmware levels by drive model.
-
Click the Change Attribute icon on the Pivot Table Toolbar.
-
In the Change Attributes dialog box, rearrange the attributes so the Selected Attributes list is as follows:
-
Drive Model
-
Drive Firmware Version
-
Library Complex Name
Note:
The last attribute in the list — in this case, Library Complex Name — always designates the column headers. The remaining attributes designate the row layers, nested in the order listed — in this case, Drive Firmware Version within Drive Model. -
-
Click OK.
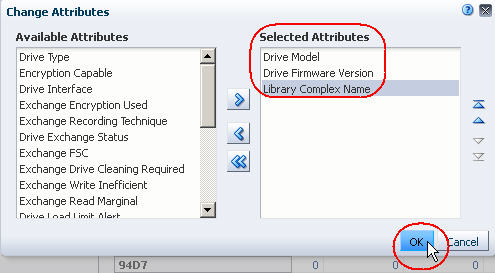
Description of the illustration ''exp_drvfwpivchgattrib2.jpg''
The pivot table is updated according to your criteria.
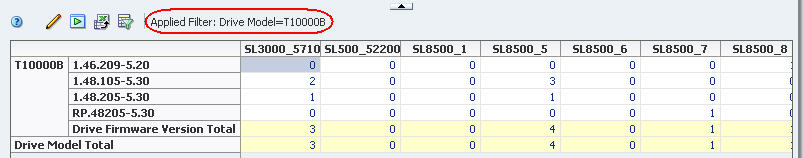
Description of the illustration ''exp_drvfwpivt10kb.jpg''
-
-
To display a detailed listing of any of the subtotals, click the text link in a cell.
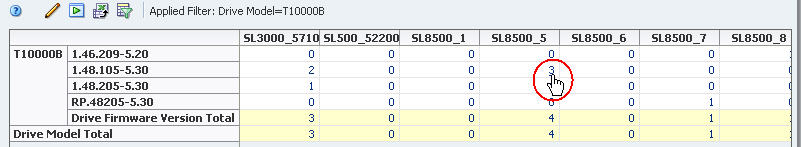
Description of the illustration ''exp_drvpivlink.jpg''
You are taken to the Drives – Overview screen, which displays additional detail for the drives included in the selected subtotal.
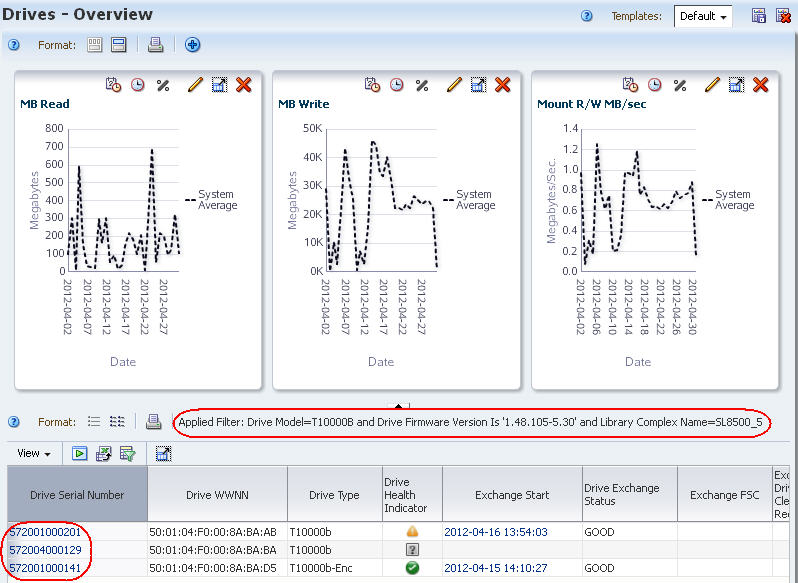
Description of the illustration ''exp_drvovwt10kb.jpg''
Best Practices for Investigating Tape Environment Issues
This section provides tips for investigating issues with drives and media.
- Tape alert detail
-
Tape alert counts for the last exchange are available on the Drive, Media, and Exchange Overview screens. To determine the nature of a tape alert, go to the Exchanges Overview Detail View and review the following sections:
-
Exchange Alerts – Severe
-
Exchange Alerts – Warning
-
Exchange Alerts – Informational
See the STA Data Reference Guide for detailed tape alert descriptions.
-
- Transient media
-
Media must be in a library storage cell or a drive at the time of a data collection for it to be detected. Media in a transient location is not detected by a data collection and therefore may not appear on the STA screens.
If media is unexpectedly missing, see ""Missing" Media" for some troubleshooting steps.
- Collect drive details
-
If you suspect a problem with a drive, save details of its recent activity to a PDF file. You can include this file in any inquiries to Oracle Service.
-
On the Drives Overview screen, select the Drive Serial Number active link to display the Detail View.
-
Save the resulting display as a PDF file.
-
- Export and review recent exchanges for a drive
-
Exchange detail may provide valuable information about a drive issue.
-
On the Drives Overview screen, select View, then Columns. then Show More Columns.
-
Move Drive Dismounts (30 days) into the Visible Columns column, then click OK.
-
Select the Drive Dismounts (30 days) aggregate count link for the drive. You are taken to the Exchanges Overview screen, filtered to show all the exchanges included in the count.
-
On the Exchanges Overview List View, select Columns, then Show All.
-
Select Export, then Exchange.xls to export the data to Excel format.
-
A fixable condition may stand out to you as you scroll through the worksheet columns. For example, you may notice that the "Media Directory Invalid" error appears on multiple media.
-
- Create a site-specific STA task cheat sheet
-
For each area of concern or activity you have accomplished in STA, document the quick steps to do it. For example:
-
Determining which drives have been cleaned over the last month
-
Determining which drives have been idle more than a week
-
Determining if some media need to be retired
-
How to do year-end planning and new media purchase estimates
Use the procedures in the preceding sections as starting points.
-