Using the PeopleSoft Fluid User Interface to Work with Absences as an Administrator
This topic discusses how administrators use the PeopleSoft Fluid User Interface to perform absence-related transactions.
For general information about fluid pages in PeopleSoft HCM, see Understanding PeopleSoft Fluid User Interface Homepages
|
Page Name |
Definition Name |
Usage |
|---|---|---|
|
HC_HGA_ADM_DASHBOARD_FL (cref for the tile) |
Access a collection tiles for Administrative tasks and Absence Event Insights. |
|
|
HC_ABSADMN_FL |
Access a collection of frequently-used Absence Management administrative components. |
|
|
HC_GP_ABS_RQST_FL |
Select to access the Absence Event Insights that contain the collection of analytics and other information. |
|
|
TL_ABS_RUN_CNTL_FL |
Process absence calculation and generate payable time for one or more calendar groups. |
|
|
Time and Labor Exceptions Page |
TL_MNG_EXCEP_NUI |
View and resolve the time and labor exceptions using Fluid User Interface. For more information, see Manage Exceptions Page |
|
HGA_PAYEE_MSG_FL |
Review the exceptions (errors and warnings) generated for absence calculations. |
|
|
Absence Event - Absence Event Entry Page |
GP_ABS_EVENT |
Enter, update, and void absences. Start the Absence Forecasting process. |
|
Review Absence Balances - Current Balance Page |
GP_ABS_CUR_BAL |
View a payee’s current entitlement balances. |
|
GP_RUNCTL |
Enter processing instructions for a payroll process, an absence take process, or an absence entitlement process. This page is used to run both on-cycle and off-cycle payrolls. |
|
|
GP_PI_GRP_ERNDED |
Enter, edit, or view positive input for payees in the same pay group and calendar. |
|
|
Results by Calendar Group - Calendar Group Results Page |
GP_RSLT_RUN_SEG |
View the processing statistics for an entire calendar group. This component displays the same information as the Results by Calendar component, except that it is for a calendar group rather than an individual calendar. Page includes links to other pages that display positive input, absence, and retroactive processing results. |
|
Absence Analytics Dashboard |
N/A |
Quickly analyze absence and payroll results using a variety of pivot grid pagelets. For more information, see Using the Absence Analytics Dashboard Pagelets. |
|
GP_ONDEMAND |
Access the pages to:
Note: TL_ABS_GENPT will be triggered when calculate is run through Off Cycle On Demand page. When you click ‘Calculate’ on Off Cycle On Demand page, the GP_PAYAFTER will be triggered which in turn trigger the TL_ABS_GENPT process. This is also applicable for Cancel button. |
|
|
Add Leave Transfer Recipients - Leave Transfer Recipients Page |
GP_ABS_LVDN_RCP |
Use this page to specify the eligible recipients for a leave transfer program. |
|
Run Leave Donation Process - Run Leave Donations Page |
GP_ABS_LVDN_RUNCTL |
Run the Leave Transfer process to process all approved leave transfer requests. |
|
Manage/Approve Leave Donations - Manage and Approve Requests Page |
GP_ABS_LVDN_APPROV |
Manage and approve leave donation requests. |
|
Leave Donations History - View Transaction History Page |
GP_ABS_LVDN_TRANS |
Review leave donation transaction history. |
|
GP_CALENDAR_PERIOD |
Define a single absence period. |
|
|
GP_CALENDAR1 |
Link together the pay group, period ID, run type ID, target calendar ID, and payee selection criteria associated with a calendar. |
|
|
GPSC_ELM_BRW_LFL |
Browse element information for a selected country. |
|
|
GP_CALENDAR_RUN |
Define a group of calendars to process together. Calendars are processed in the order listed. |
|
|
Absence Entitlements - Absence Entitlement Name Page |
GP_PIN |
Name the element and define basic parameters. |
|
Absence Takes - Absence Take Name Page |
GP_PIN |
Name the element and define basic parameters. |
|
Formulas - Formula Name Page |
GP_PIN |
Name the element and define its basic parameters. |
|
Brackets - Bracket Name Page |
GP_PIN |
Name the element and define its basic parameters. |
|
GP_BRACKET_DATA |
Update search key values and return column values for existing bracket elements. |
|
|
Country Setup for Absence Take - Entitlement Grid Page |
GP_ABS_SS_CNTRY1 |
Select the entitlement fields that appear on the View Absence Balances page. |
|
GP_ABS_ELIG_SS |
For a given Take element and country, define absence units (days or hours), who can submit and approve requests, what happens to cancelled requests, and whether to allow partial-day absences. You can also specify whether to display the absence reason and entitlement balances. |
|
|
Configure Absence Forecasting - Forecasting Page |
GP_ABS_TAKE6 |
Specify which forecasting result elements to display in the Forecasting Results grid. Also specify whether to display a customized label from the HR Text Catalog as the description or the element description as defined on the Element Name page (GP_PIN). |
|
GP_ABS_EA_ADM |
Edit or approve extended leave requests. The extended absence administrator can also use this page to check the extended absence history and view details for an extended absence. |
|
|
GP_ABS_EA_REQ |
Request an extended absence using the defined extended absence types. Review the status of an extended leave |
|
|
HC_GP_ABS_RQST_FL (this is the cref for the tile) |
Access a dashboard to analyze the employee absences event data. |
|
|
HC_GP_ABS_RQST_FL |
View and analyze absence event data using Insights visualizations. |
|
|
HC_HGA_PROCESSED_EVT_FL (this is the cref for the tile) |
Access a dashboard to analyze the employee processed absences data. |
|
|
Insights Visualizations: Processed Absence Insights Dashboard |
HC_HGA_PROCESSED_ABS, HC_HGA_PI_GEN, and HC_HGA_BALANCE_TRENDS |
View and analyze processed absence data using Insights visualizations. |
Administrators use the Absence Administration dashboard to access the tile collection for frequently-used Absence Management administrative components.
Navigation:
Select Fluid Home under the main menu. On the page that appears, select Workforce Administrator. The Absence Administration tile is available on the Workforce Administrator landing page.
The Absence Administration tile is delivered as part of the Workforce Administrator home page, but the location can change if you change the delivered home pages or if administrators personalize their home pages.
This example illustrates the Absence Administration tile.
Click the Absence Administration dashboard tile to access the tile collection landing page for Administrative tasks and Absence Event Insights tile.
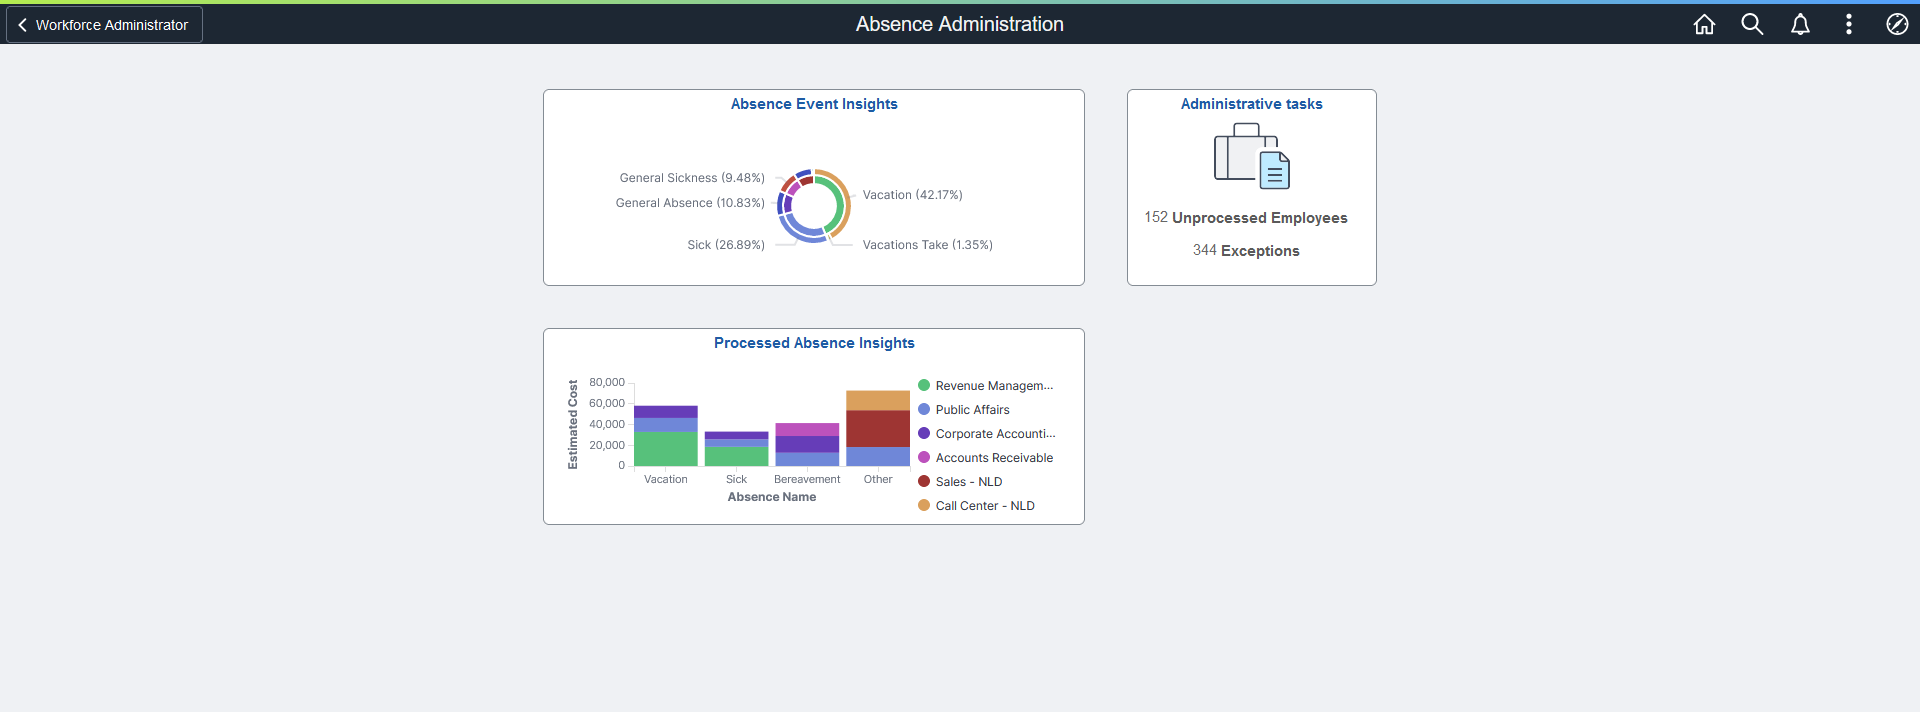
This example illustrates the Absences Administration dashboard.
Use the Administrative tasks tile to access a collection of frequently-used Absence Management administrative components.
Navigation:
Select Administrative tasks tile to access Absence Administration application start page.
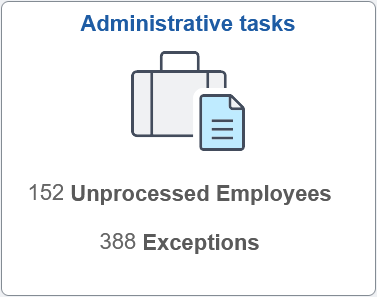
This example illustrates the fields and controls on the Administrative tasks tile.
Field or Control |
Description |
|---|---|
Unprocessed Employees |
Displays the number of employees for whom approved absence has not been processed. |
Exceptions |
Displays sum of the errors and warnings from absence and TL exceptions. |
Note: Unprocessed Employee Count/Exceptions Count is displayed only if the Generate Absence Payable Time check box is selected on the Configurations Page.
Click the tile to access the Absence Administration application start page.
This example illustrates the Absence Administration Start page.
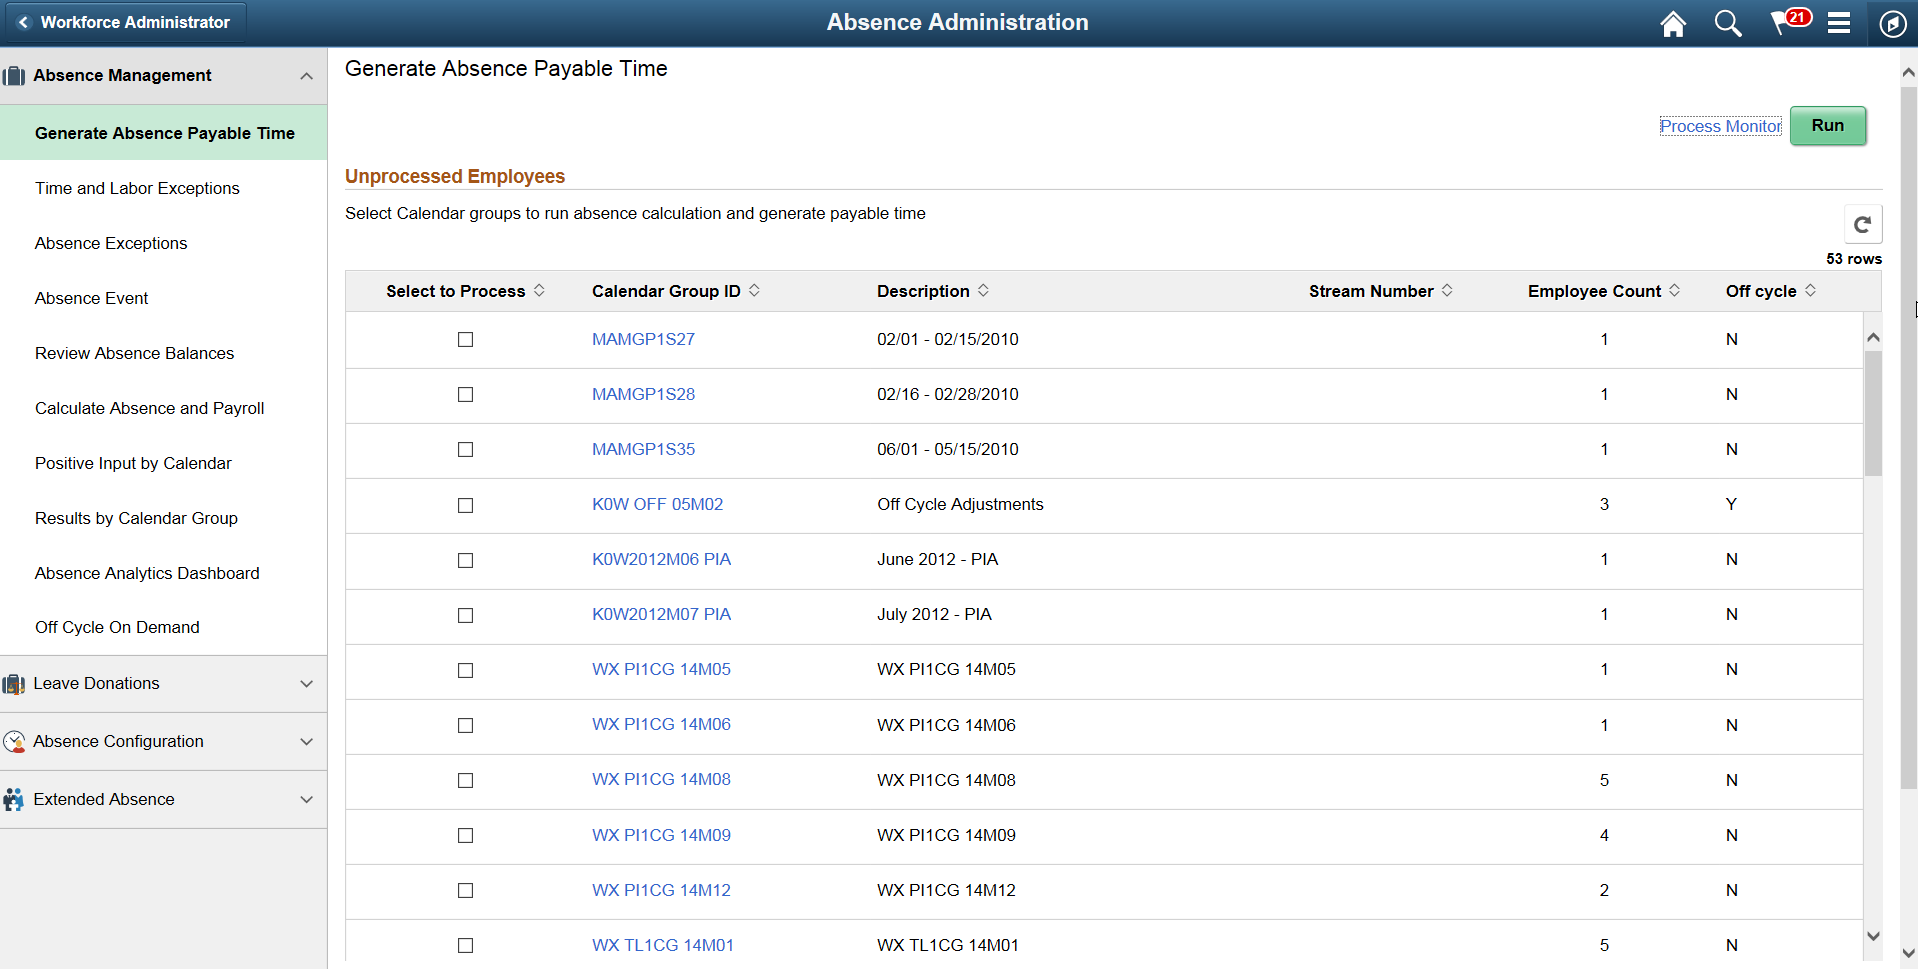
This application start page is a navigation collection that enables administrators to access frequently-used Absence Management components from one location. The left panel of this page lists the components collected under four categories:
Absence Management
Leave Donations
Absence Configuration
Extended Absence
The right panel displays the component selected in the left panel.
Use the Absence Exceptions page (HGA_PAYEE_MSG_FL) to view the details of the errors and warnings for absence calculations.
Navigation:
Click the Absence Administration tile on the Workforce Administrator fluid home page and select Absence Exceptions from the Absence Management navigation collection.
Click the Absence Calculations Tile from Exceptions section on the Generate Absence Payable Time page.
This example illustrates the Absence Exceptions Page.
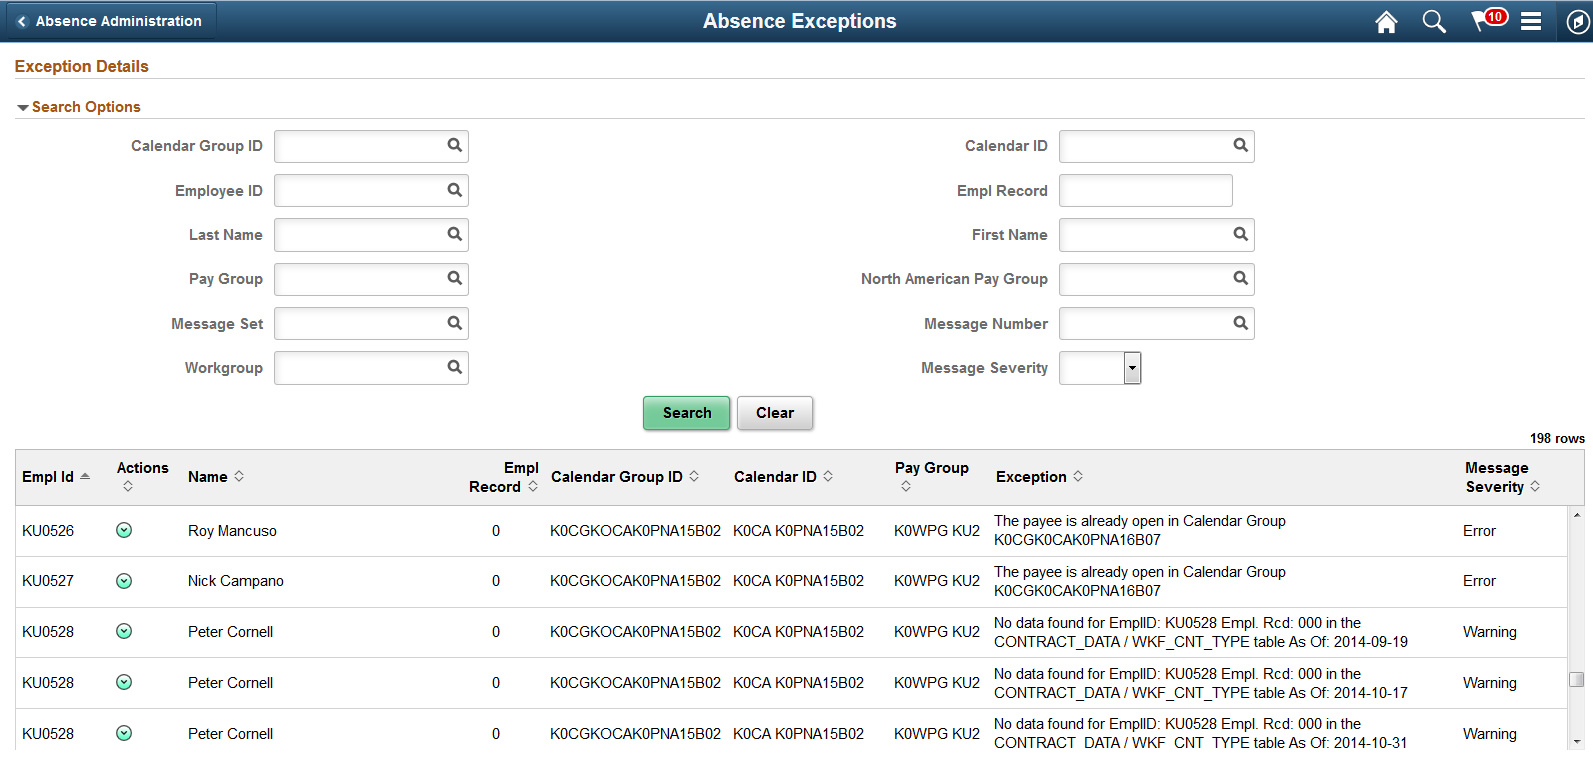
Field or Control |
Description |
|---|---|
Search Options |
Use the search option to filter the exception details using Calendar Group Id, Calendar Id, Employee Id, Employee Record, Name, Pay Group, Message Set, Message Number, Workgroup and Severity. |
Actions |
Use the related actions to access the following pages:
|
The administrator can use the Absence Event Insights tile to access Insights Visualizations: Absence Event Insights Dashboard and analyze the employee absences event data.
This example illustrates the fields and controls on the Absence Event Insights tile.
Based on user privileges, administrators can access the visualizations delivered on the Absence Event Insights dashboard.
The absence event data is the data submitted by employee, manager or administrator.
The Absence Event Insights Analytics dashboard is built on the PeopleSoft Insights platform, which relies on an underlying analytics engine and search engine. Absence Event data that is visible on the dashboard comes from the HC_GP_ABS_RQST search index.
For information on Insights, see PeopleTools Search Technology, “Monitoring PeopleSoft Search Framework and OpenSearch” and “Working with Insights Dashboards for PeopleSoft Application Data” documentation.
These videos provide an overview of the Insights feature:
Video: Insights with PeopleSoft
Video: PeopleSoft HCM Insights
Note: The absence counts are count by events and not the days of absences.
The canceled absences are excluded from the absence type and name visualization.
Deploying the Absence Event Insights Analytics
Before administrators can access the Absence Event Insights data in PeopleSoft Insights, the following steps should be performed:
Deploy the HC_GP_ABS_RQST (Absence Events data) index.
()
Build the HC_GP_ABS_RQST search index.
()
Deploy the Absence Event Insight Tile and Absence Event Insights dashboard.
()
Note: The full index must be run before the dashboard can be deployed.
Assign Absence Insights Administrator roles to administrators to access and view Absence Events Insight Analytics visualizations.
PeopleSoft Absence Analytics Event Insights dashboard provides administrators the ability to view and analyze absence event data using Insights visualizations.
Navigation:
This video provides an overview of the Absence Management Insights feature:
Video: Image Highlights, PeopleSoft HCM Update Image 38: Absence Event Insights Dashboard
This example illustrates the fields and controls on the Absence Event Insights dashboard. You can find definitions for the fields and controls later on this page.
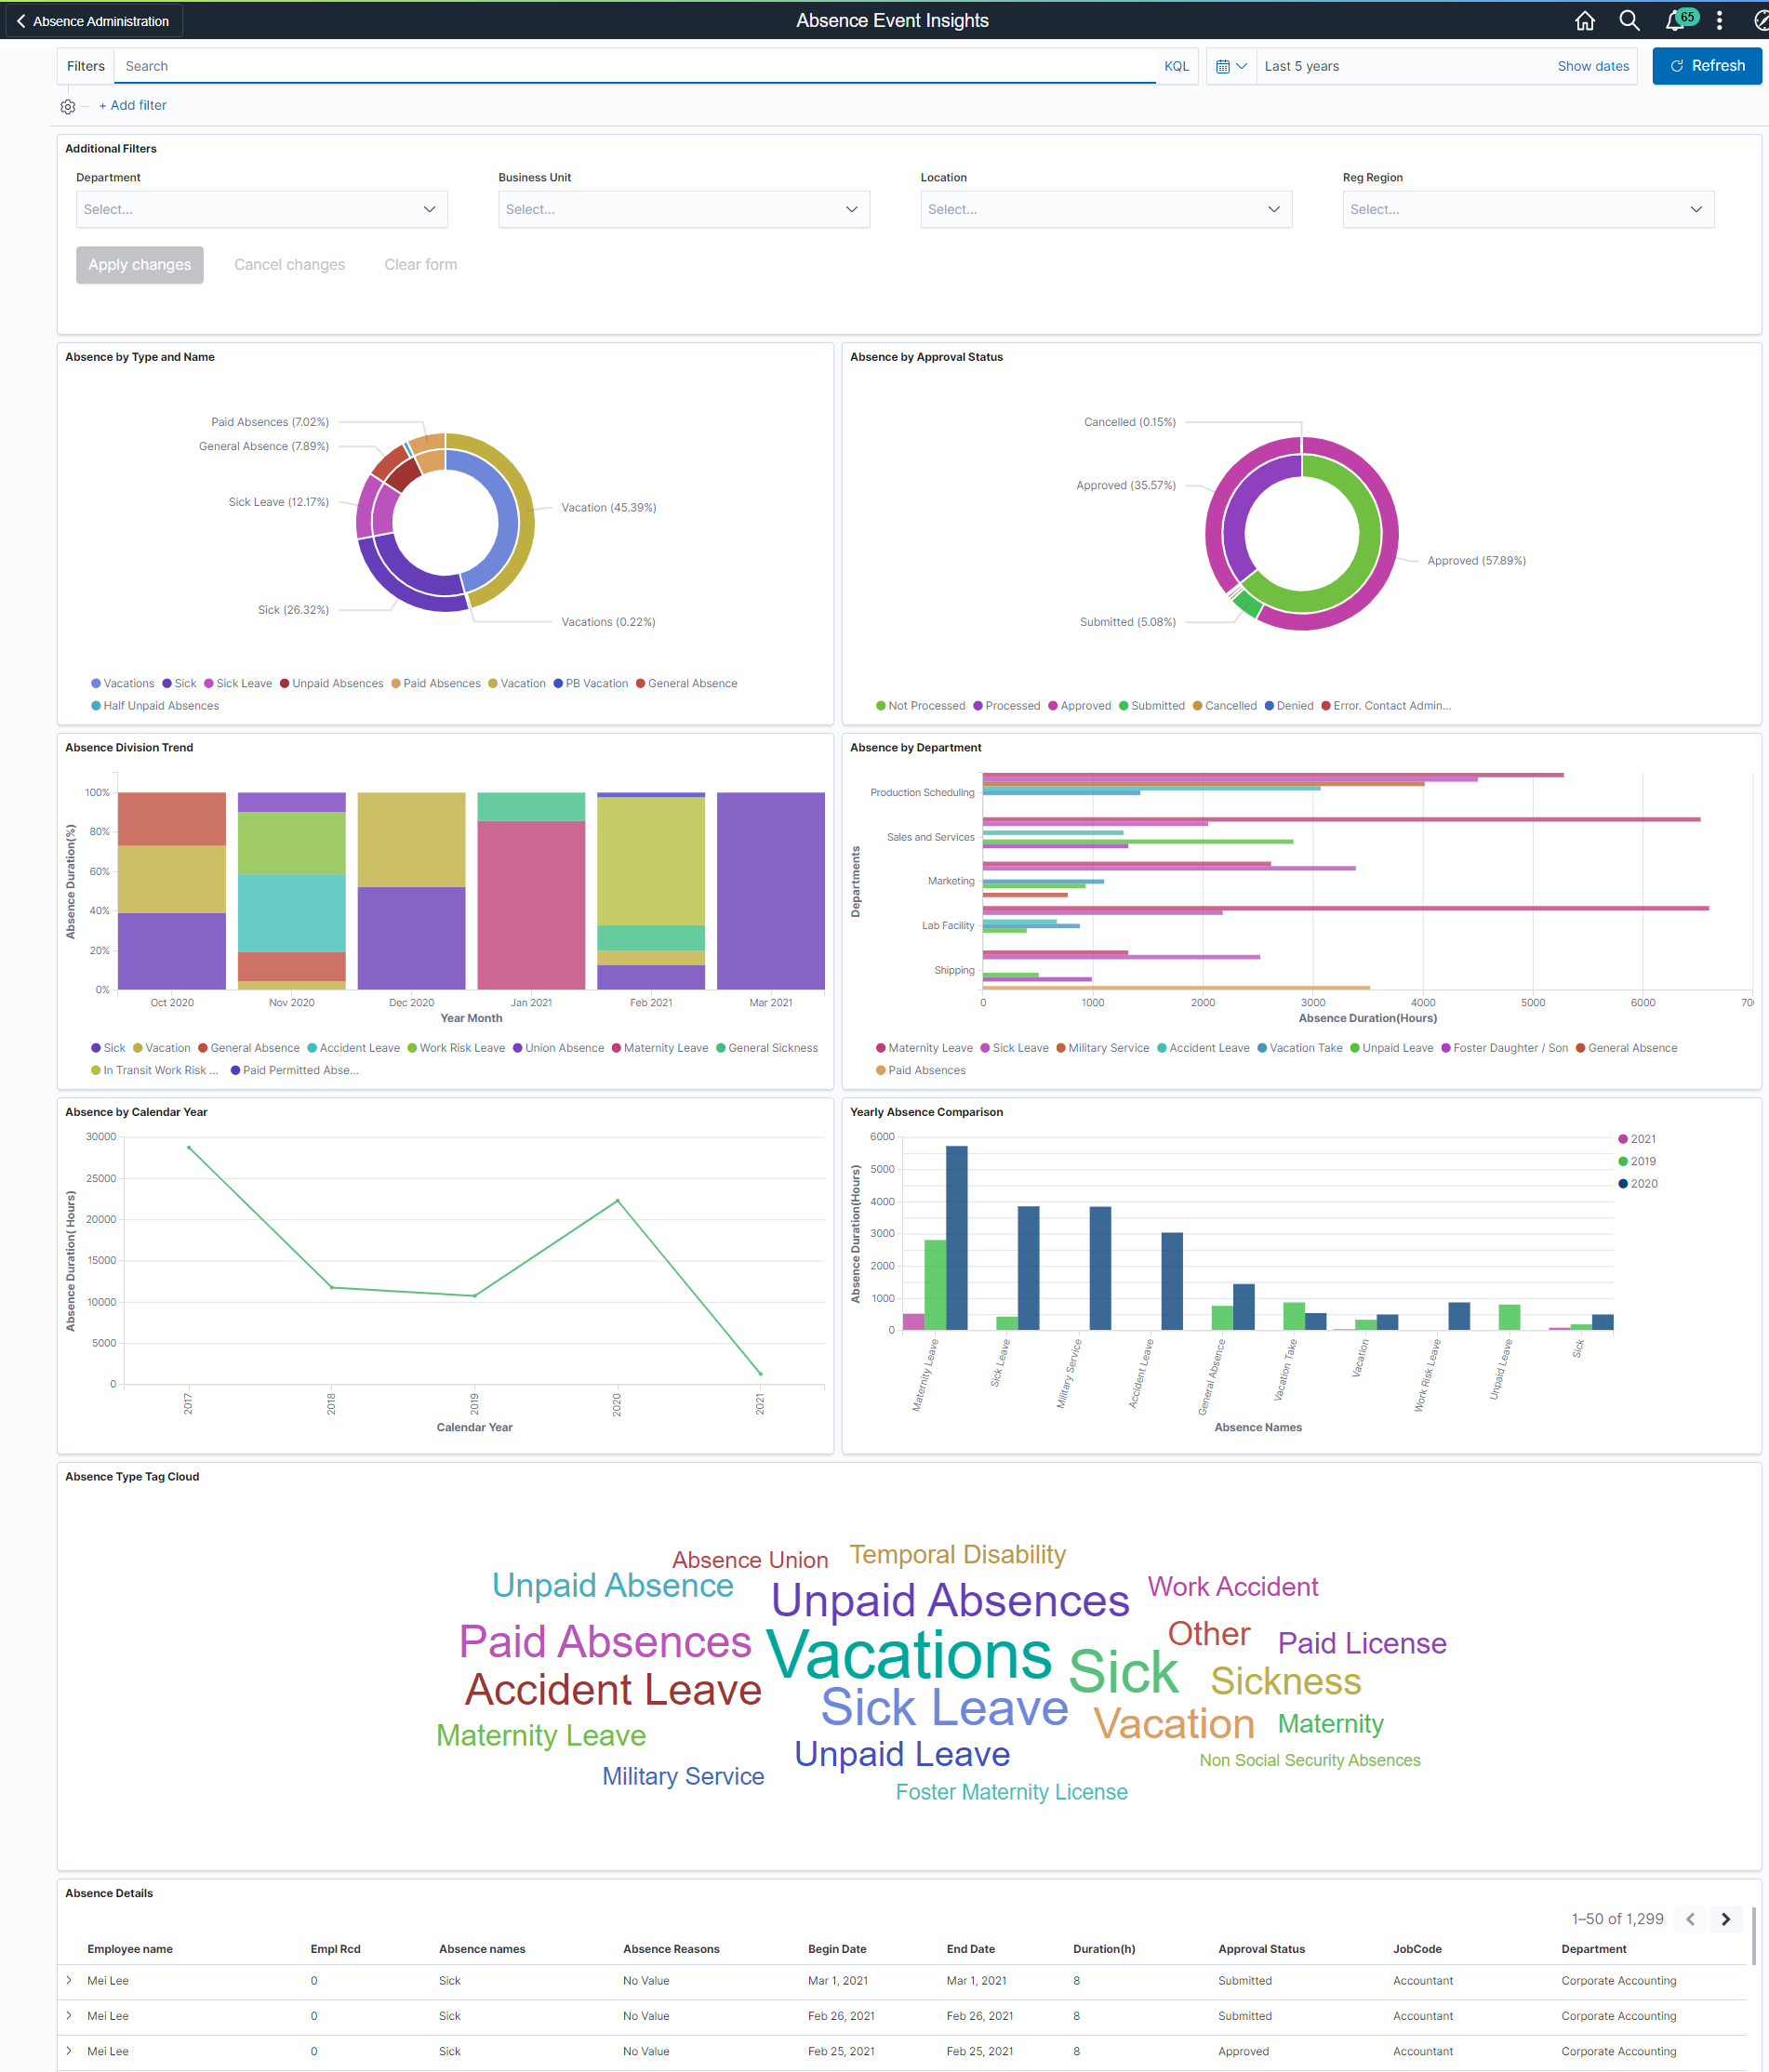
The different visualizations can be used by the administrator to:
Work with managers and first level administrators to manage absenteeism in their realm of work.
Take corrective actions before processing absences.
Common Elements and Controls
Note: Filtering options apply to all visualizations, which allows administrators to drill down on all the charts at once.
Field or Control |
Description |
|---|---|
Open in Insights |
This link appears only for users with role Absence Insights Administrator. |
Filters search field |
Enter criteria to filter data on the visualizations. You can add filters in a number of ways:
|
|
Click to select a different time period for the analytics. You can enter it manually, or choose from commonly used date ranges provided by the system or from the recently used selections. When a new period is selected, all visualizations are refreshed automatically to reflect that change. If you have selected a commonly used date range, for example, This month, or Week to date, click the Show dates link to view the approximate date period in relation to the current date. For example, the current date is November 1 and the selected date range is Year to date. Clicking the Show dates link displays ~ 10 months ago —> now, which indicates that the selected date range started from approximately 10 months ago and ends on the current date. |
 , Change all filters icon (Change all filters), and
  Calendar icon (Calendar) or
 Additional Filters
This example illustrates the fields and controls on the Additional Filters. You can find definitions for the fields and controls later on this page.
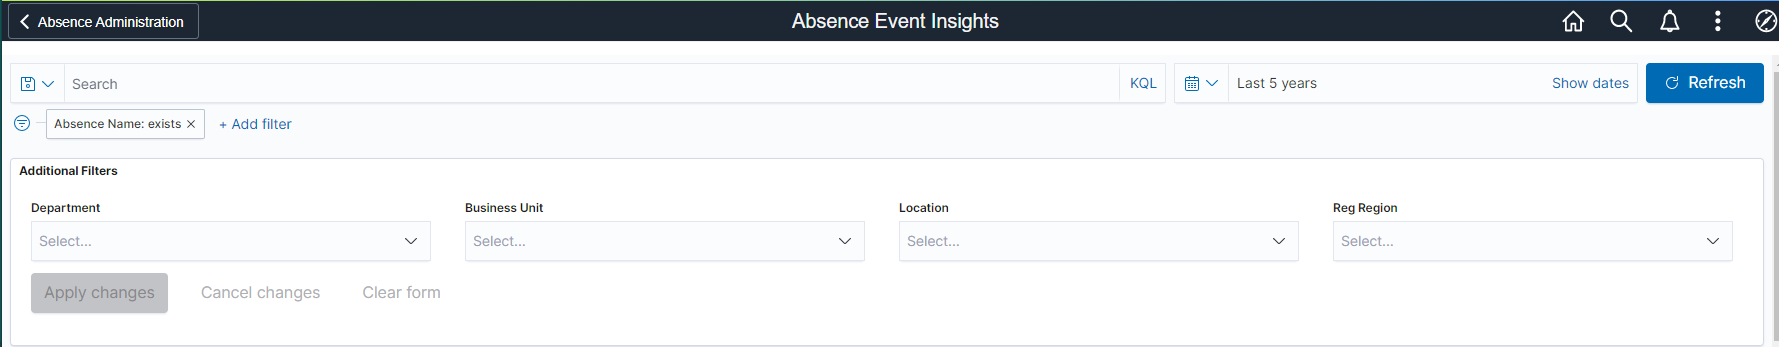
Note: By default, the data populates for the past five years.
Additional Filters allow you to select the following filters:
Department
Business Unit
Location
Regulatory Region
Absence by Type and Name Visualization
Use this visualization to view the absences by type and name for the selected period in an organization.
This example illustrates the fields and controls on the Absence by Type and Name.
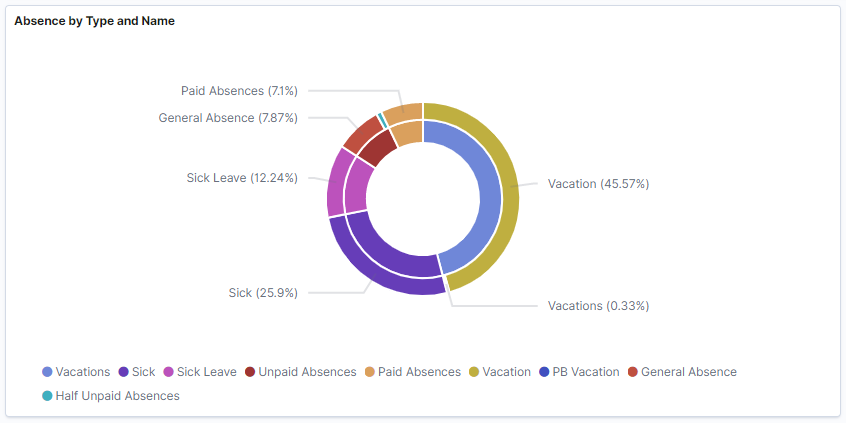
The double doughnut visualization represents count of different absence within each absence type used by the organization. The inner doughnut is the absence type and outer doughnut represents the absences names within each type.
Absence by Approval Status Visualization
Use this visualization to view the absences by approval status for the selected period in an organization.
This example illustrates the fields and controls on the Absence by Approval Status.
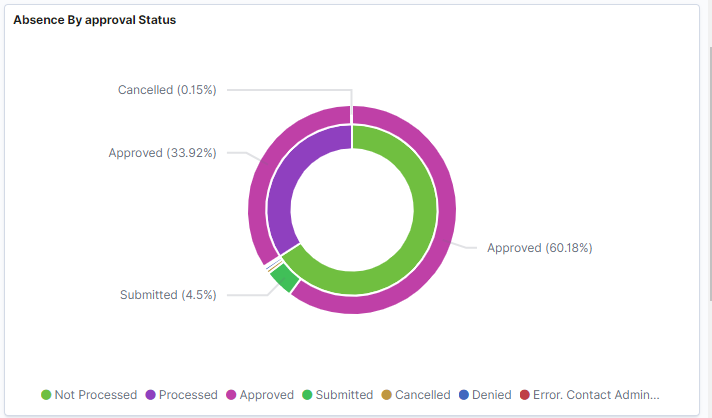
This visualization represents the absences on the basis of approval status. Here, the inner doughnut is the absence processed and unprocessed status and the outer one is the absence approval status within each of it.
Absence Division Trend Visualization
Use this visualization to view the absence division trend for the selected period.
This example illustrates the fields and controls on the Absence Division Trend.
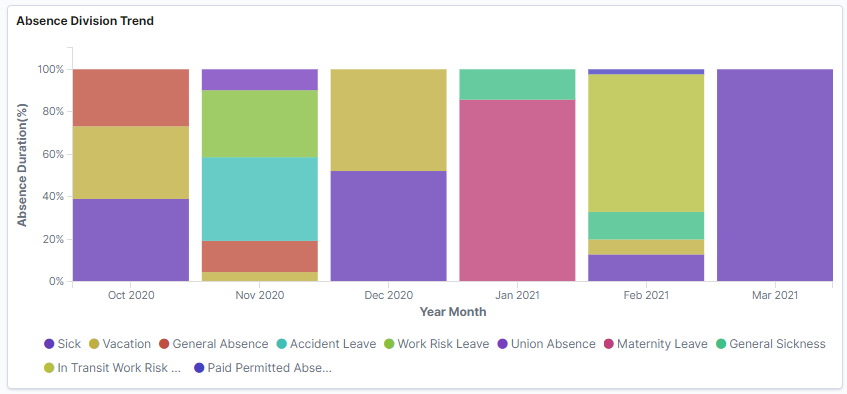
The bar chart shows the percentile information of each absences and represents the monthly trend of absence submissions. The default setting is for the last six month of data.
Note: If the Administrators have access rights to update the design of visualization, they can do it in the Insights Designer mode.
Absence by Department Visualization
Use this visualization to view the absence trends by department for the selected period.
This example illustrates the fields and controls on the Absence by Department.
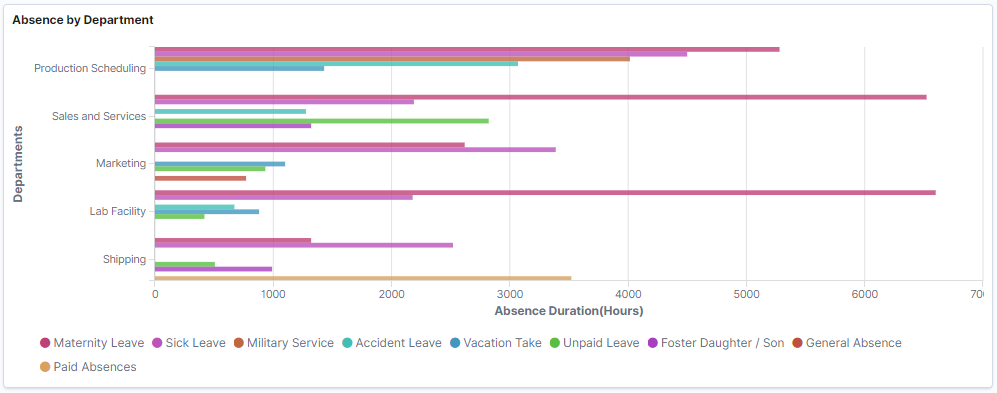
This visualization represents absence duration by departments and shows how the absences are submitted across departments in terms of absence duration. The default visualization is set for five departments.
Absence by Calendar Year Visualization
Use this visualization to view the absence by calendar year for the selected period.
This example illustrates the fields and controls on the Absence by Calendar year.
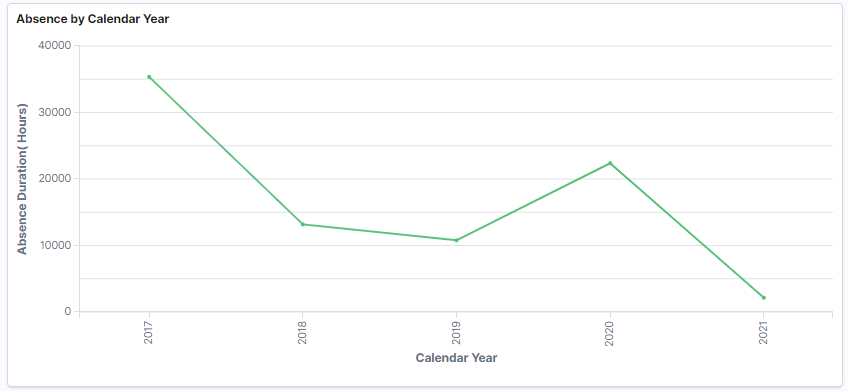
Line diagram which represents the totals or cumulative of absence duration in hours. You can check the absenteeism by year on year. The default visualization is set for five years.
Yearly Absence Comparison Visualization
Use this visualization to view the absence duration trends in hours by its names for the selected period.
This example illustrates the fields and controls on the Yearly Absence Comparison.
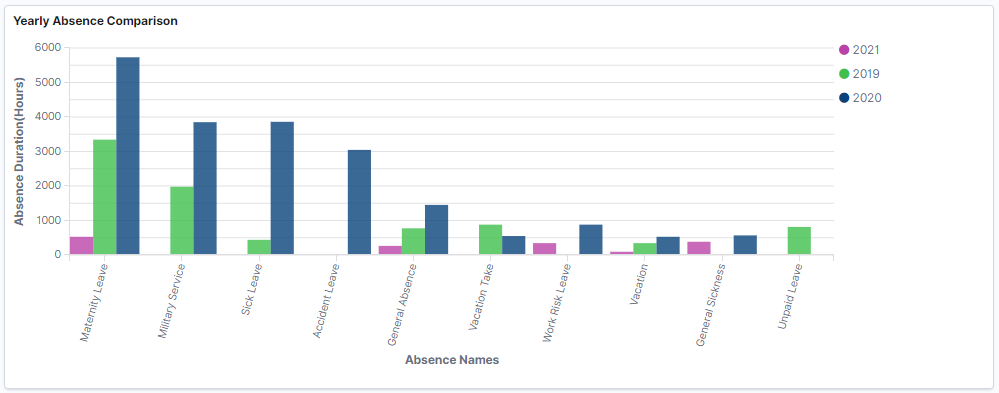
The bar chart with different color shows the year-on-year trend by absence name. This is on the basis of the timeline selected. The default is set to three years of calendar year series.
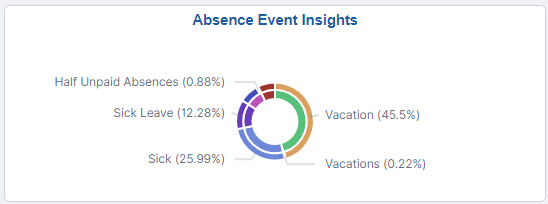
Absence Type Tag Cloud
The Administrator can view the information regarding a particular Absence and on selecting the absence name, it gives more information in different analytics.
This example illustrates the fields and controls on the Absence Type Tag Cloud.
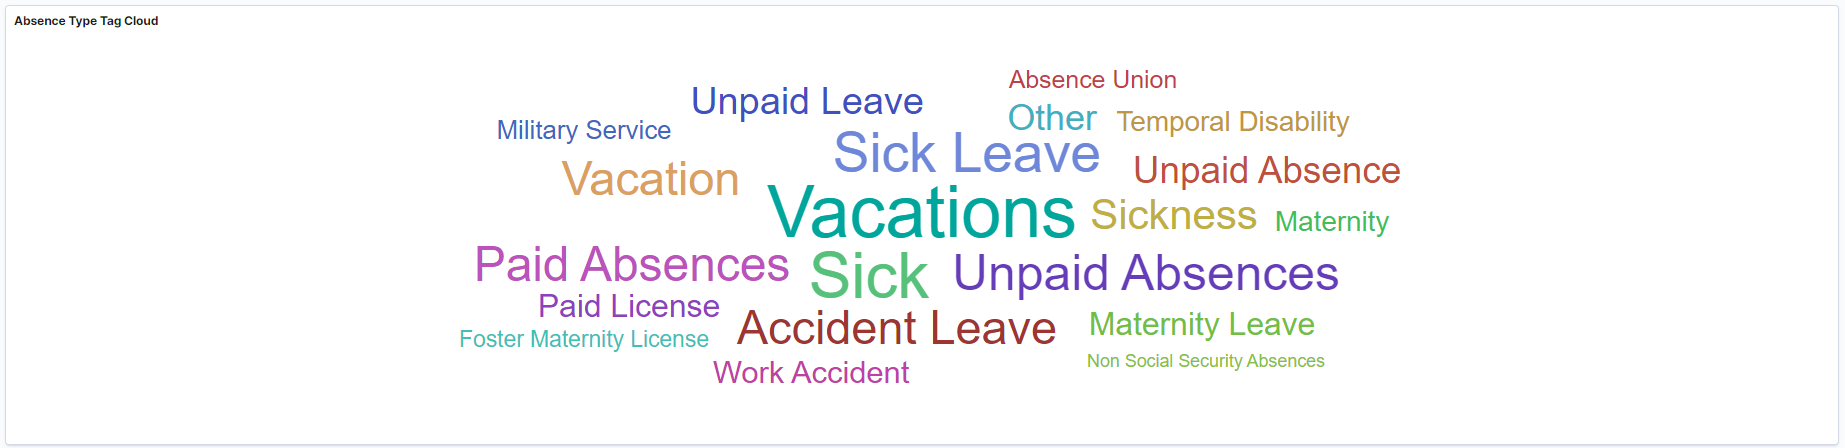
The absence types labels size appear in the descending order of most applied, with the size of the absence type label with most applied absences displayed as the biggest. In this case, it is Vacation. The Administrator can use this information as the immediate filter, much more than the filter applied. On selecting one particular absence type refreshes the entire dashboard.
Absence Details
This example illustrates the fields and controls on the Absence Details.
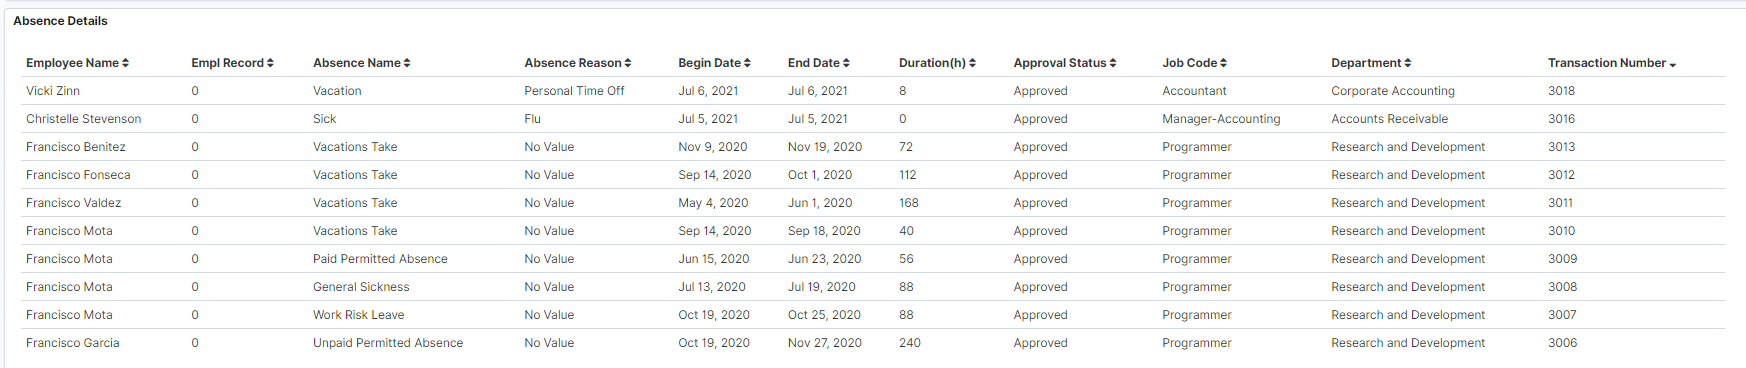
Absence details is the customizable list of information presented based on user needs.
The administrator can use the Processed Absence Insights tile to access Insights Visualizations: Processed Absence Insights Dashboard and analyze the employee processed absences data.
This example illustrates the fields and controls on the Processed Absence Insights tile.
Based on user privileges, administrators can access the visualizations delivered on the Processed Absence Insights dashboard.
The processed absence data is the data submitted by employee, manager or administrator.
For information on Insights, see PeopleTools Search Technology, “Monitoring PeopleSoft Search Framework and OpenSearch” and “Working with Insights Dashboards for PeopleSoft Application Data” documentation.
These videos provide an overview of the Insights feature:
Video: Insights with PeopleSoft
Video: PeopleSoft HCM Insights
Deploying the Processed Absence Insights Analytics
Before administrators can access the Processed Absence Insights data in Insights, the following steps should be performed:
Deploy the HC_HGA_PROCESSED_ABS (Processed Absence data) HC_HGA_PI_GEN (Absence Generated Positive Input) and HC_HGA_BALANCE_TRENDS (Absence Balance Trends) index.
()
Deploy the Processed Absence Insights Tile and Processed Absence Insights dashboard.
()
Note: The full index must be run before the dashboard can be deployed.
Assign Absence Insights Administrator roles to administrators to access and view Processed Absence Insight Analytics visualizations.
Processed Absence Insights dashboard provides administrators the ability to view and analyze processed absence data using Insights visualizations.
Navigation:
Note: If the Administrators have access rights to update the design of visualization, they can do it in the Insights Designer mode.
This example illustrates the fields and controls on the Processed Absence Insights dashboard. You can find definitions for the fields and controls later on this page
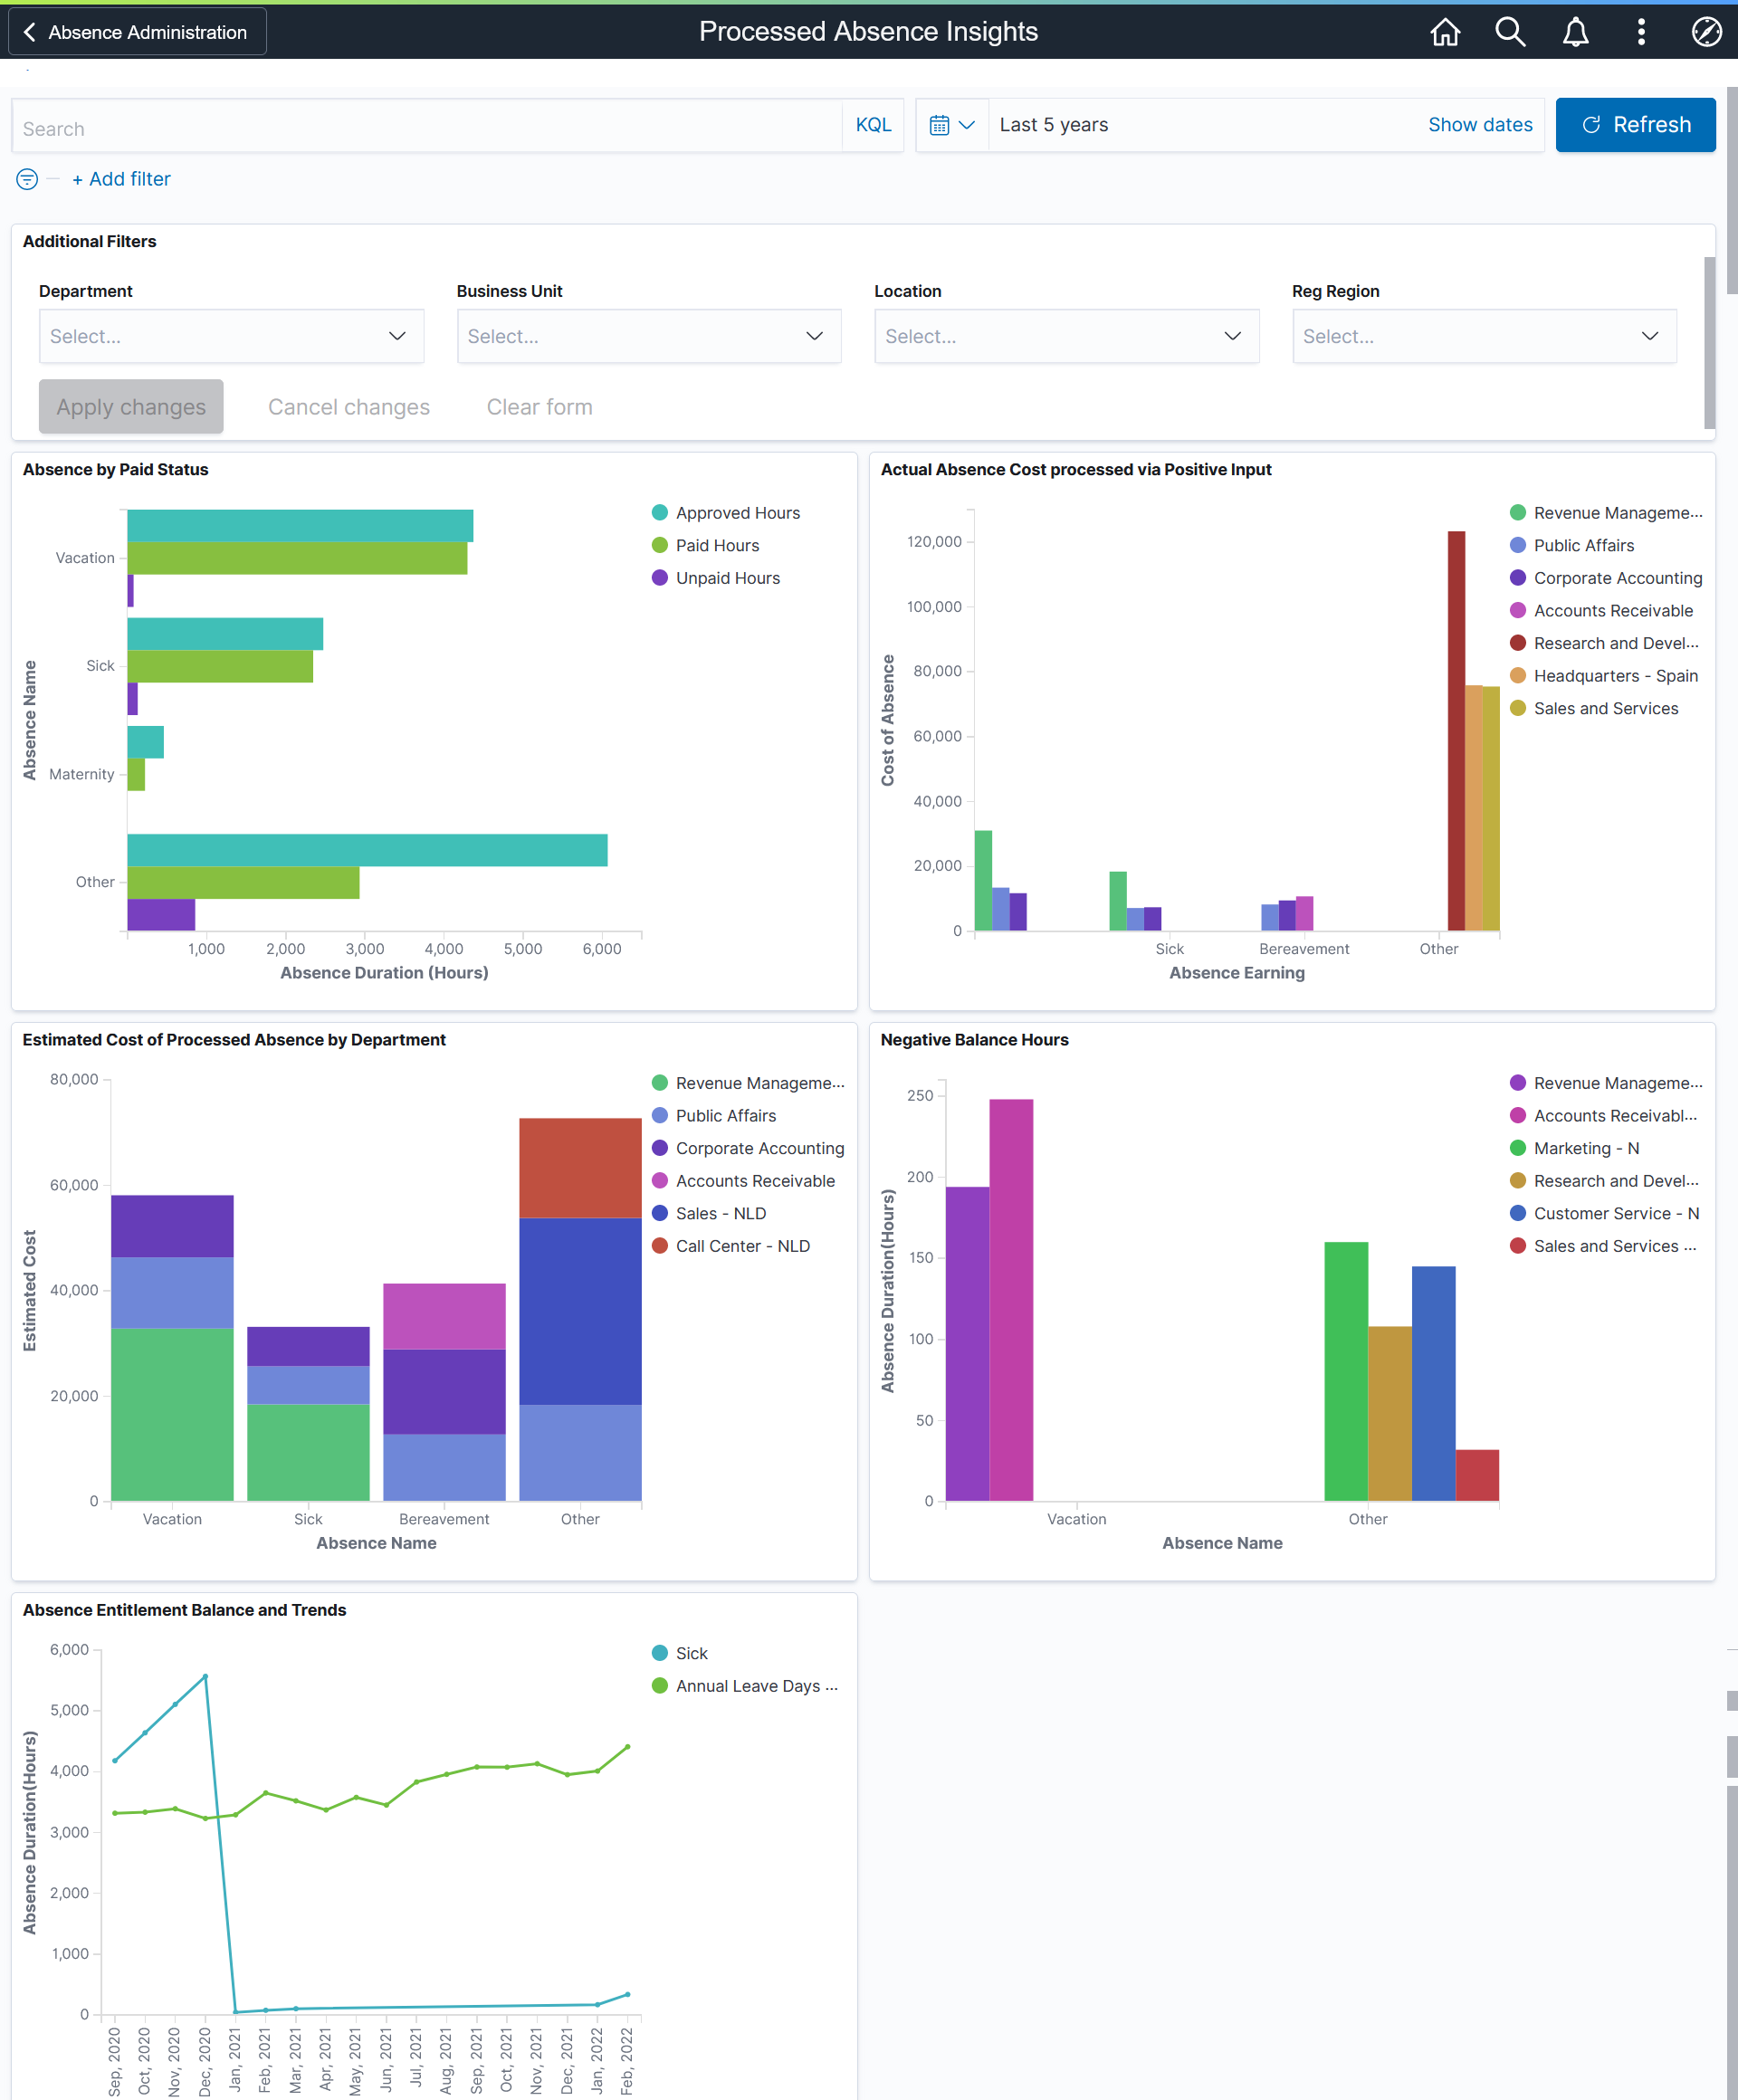
The different visualizations can be used by Administrator to:
View the processed absence data for the employee.
Work with HR, Finance and first level administrators to understand/ manage absence cost, productivity and liabilities.
Additional Filters
This example illustrates the fields and controls on the Additional Filters. You can find definitions for the fields and controls later on this page.
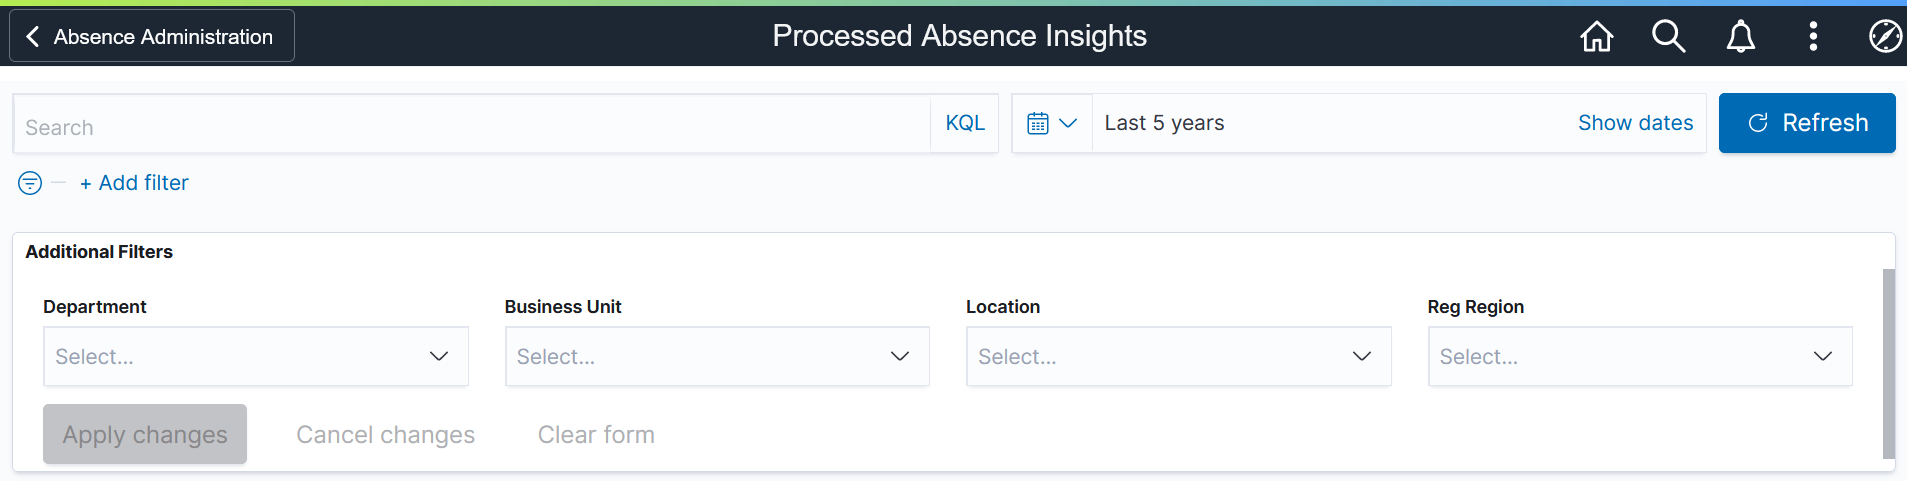
Note: By default, the data populates for the past five years.
Additional Filters allow you to select the following filters:
Department
Business Unit
Location
Regulatory Region
Absence by Paid Status Visualization
Use this visualization to view the absences by paid status for the selected period in an organization.
This example illustrates the fields and controls on the Absence by Paid Status Visualization.
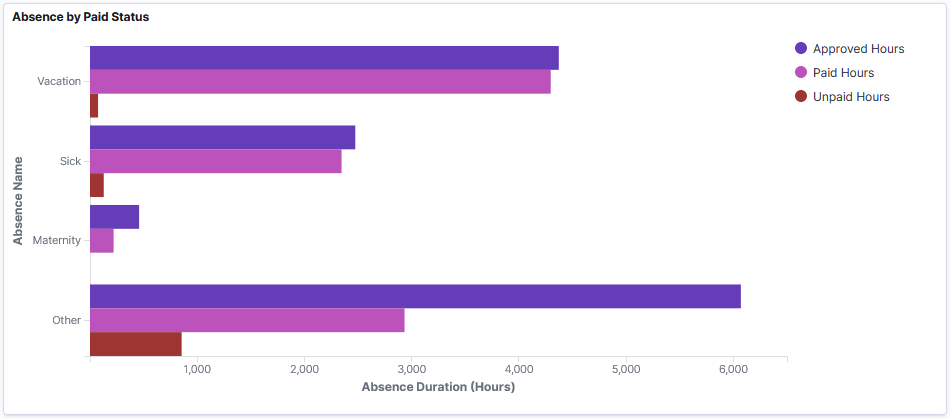
This visualization represents the total hours of approved absences and how many of those hours were paid versus unpaid. Each absence type used by the organization will be represented.
Actual Absence Cost processed via Positive Input
Use this visualization to view the cost of generated positive input by department for different absence types.
This example illustrates the fields and controls on the Actual Absence Cost processed via Positive Input Visualization.
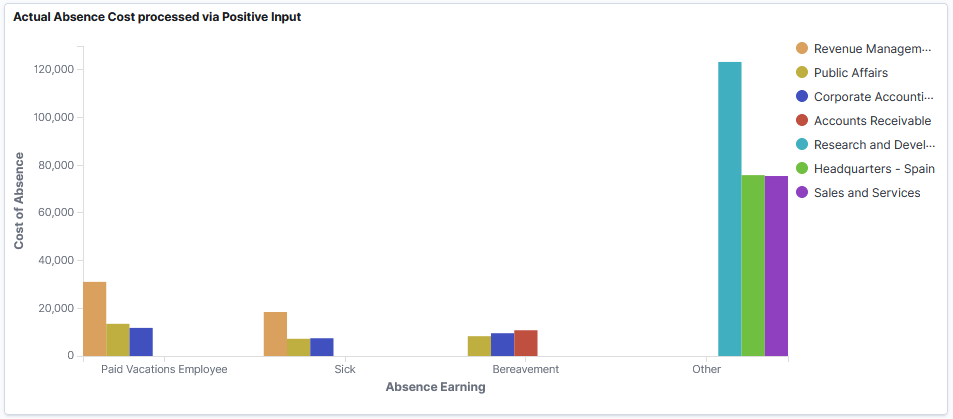
The bar chart shows the cost of positive inputs for each absence types in each departments.
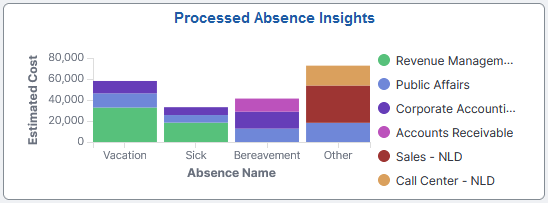
Estimated Cost of Processed Absence by Department
Use this visualization to view the cost of processed absences by department for the selected period in an organization.
This example illustrates the fields and controls on the Estimated Cost of Processed Absence by Department.
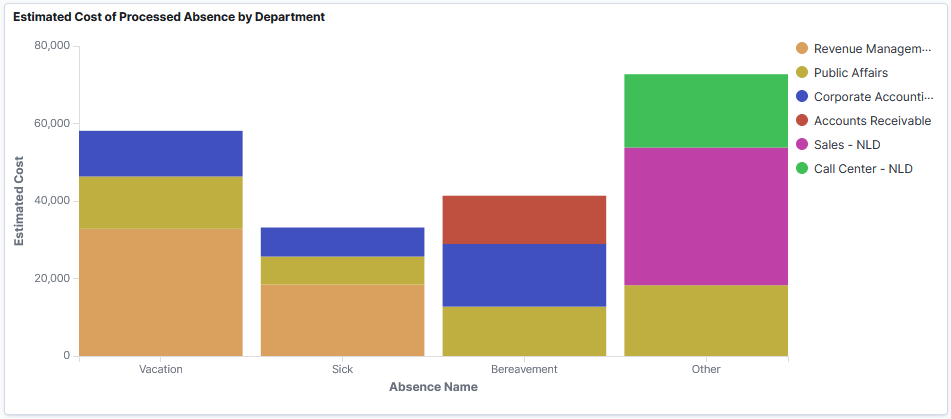
The bar chart represents the cost of different absences by departments.
Negative Balance Hours Visualization
Use this visualization to view the number of negative absence balance hours for each absence type for the selected period.
This example illustrates the fields and controls on the Negative Balance Hours Visualization.
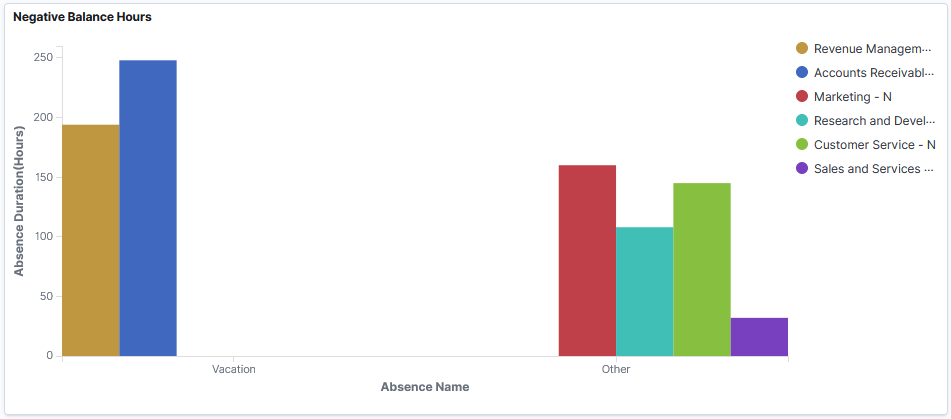
This visualization represents negative absence balances in hours for each absence type by department. The default visualization is set for six departments.
Absence Entitlement Balance and Trends Visualization
Use this visualization to view the trend of absence balances by absence type and month.
This example illustrates the fields and controls on the Absence Entitlement Balance and Trends Visualization.
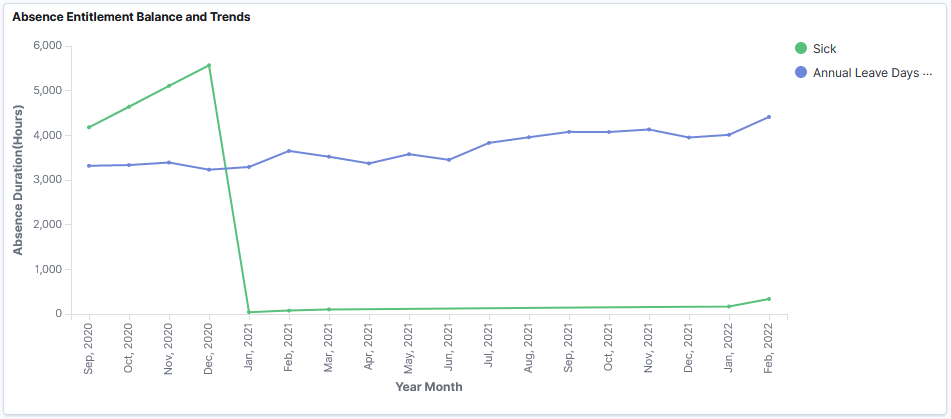
Line diagram which represents the entitlement balances by month.