5 How Do I Embed a Report in a Sales Dashboard?
This tutorial shows you how to embed a report in a sales dashboard. The type of report shown in this tutorial is an Oracle Business Intelligence analysis.
How to Embed a Report in a Sales Dashboard
-
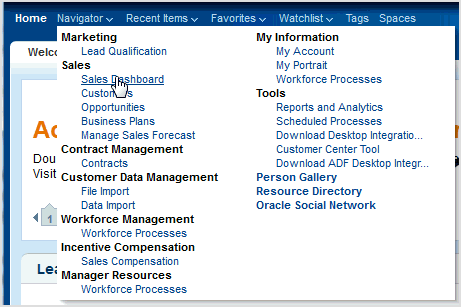
From the Navigator menu, select Sales Dashboard.

-
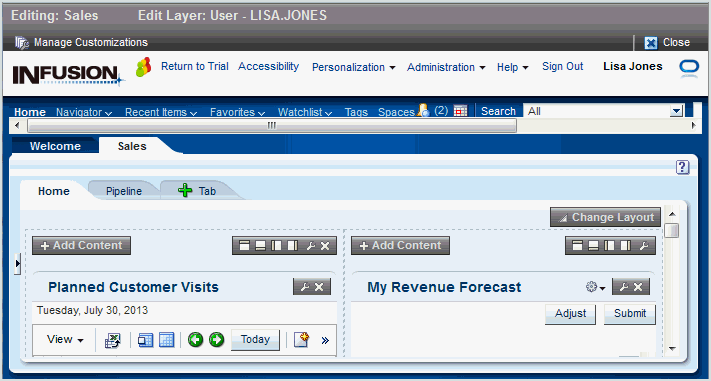
Go to the Sales tab.
-
Click Personalization and select Edit Current Page.

The page is now in Edit mode.

-
(Optional) To create a new tab to embed an analysis:
-
Click the green plus sign to create a new untitled tab.
-
Enter a name for the untitled tab.

In this example, the name is New Leads.
-
Click Rename this tab to save the name.
-
(Optional) Click Change Layout to select a layout for the new tab (two-column, three-column, and so on).
Note:
A single- or double-column layout provides a wide enough view for reports.
-
-
To add an analysis to a tab:
-
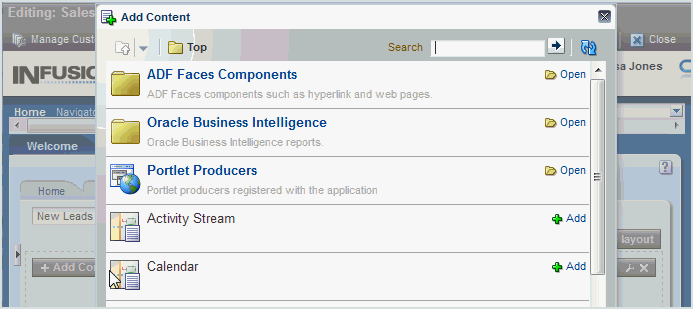
Click Add Content in the page location where you want to display the analysis.
The Add Content search list is displayed.

-
Click the Oracle Business Intelligence folder, and navigate to an appropriate folder containing the analysis that you want to add.
For example, open the Shared Sales Reports folder, and then the Opportunity and Revenue Management folder.
-
Click Add next to the analysis you want to add.
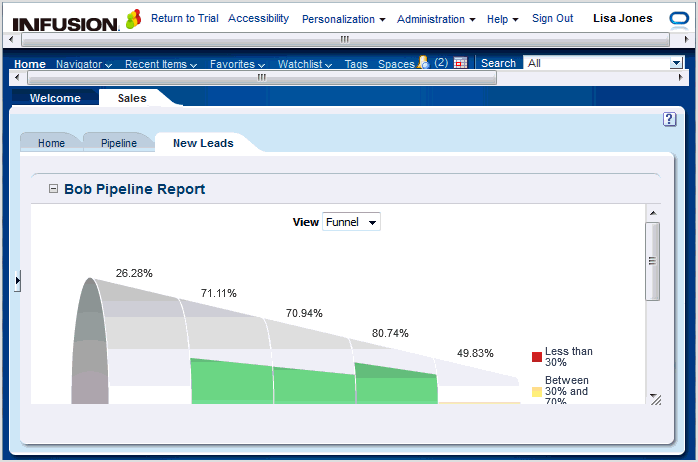
For example, add the Bob Pipeline Report.

-
Click the cross in the upper right corner to close the search list.
To add an additional analysis, repeat steps a to d.
-
Click Close to save the changes and exit Edit mode.
The analysis is added to the page.

-


