4 Evaluating Workforce Costs
This tutorial shows you how to view and evaluate workforce costs.
You want to see a high level view of workforce costs for a particular month as well as trends over the past 12 months.
Use the sparkline tiles and reports in the HR Executive Dashboard — Global Workforce Costs page to help you gain valuable insight into major payroll spending categories, such as salaries, overtime, and bonuses.
To view the HR Executive Dashboard — Global Workforce Costs page:
-
Launch the OTBI Enterprise for Human Capital Management Cloud Service URL provided by your administrator.
-
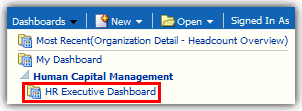
From the Dashboards menu, expand Human Capital Management, and then select HR Executive Dashboard.
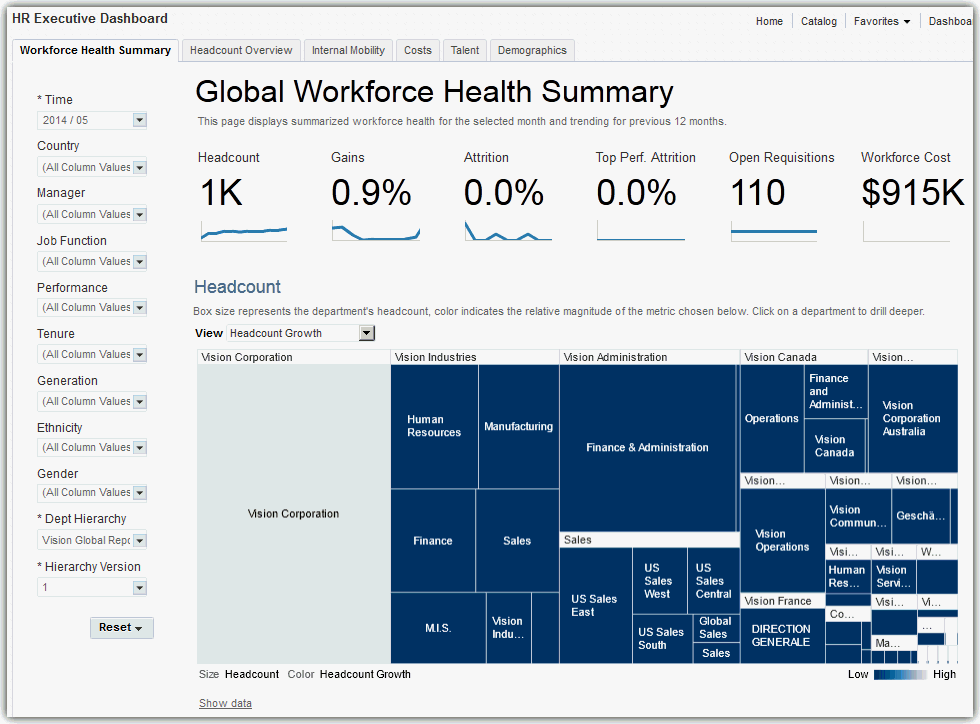
The HR Executive Dashboard — Global Workforce Health Summary page is displayed.
-
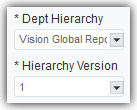
In the left pane on the dashboard page, verify that the Department Hierarchy and Hierarchy Version dashboard prompt list values are set correctly. This step ensures that the data displayed on the HR Executive Dashboard is accurate.
If you are uncertain which values to select, consult with your OTBI Enterprise for HCM Cloud Service implementer or administrator. Your implementer or administrator can set these values to default to the correct selections.
-
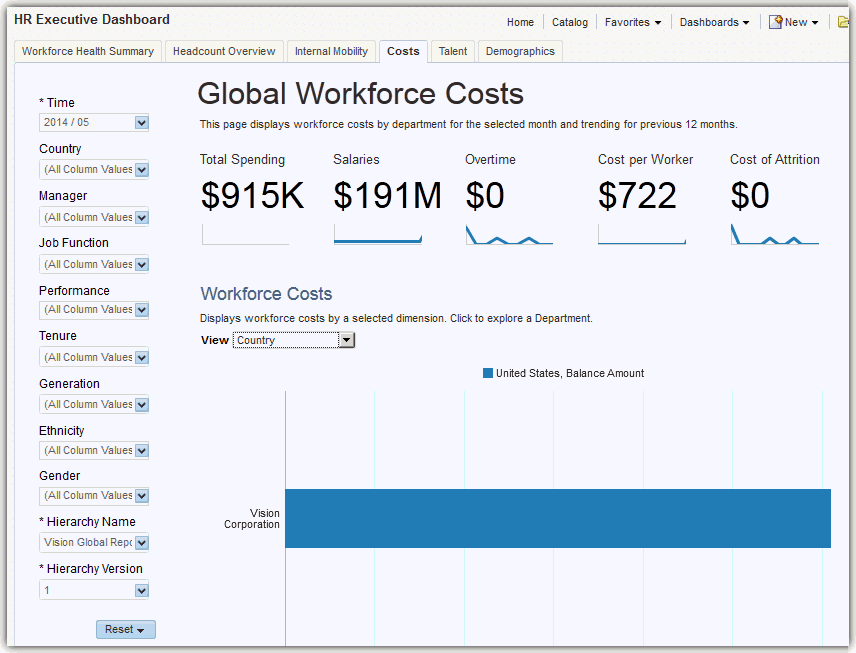
Select the Costs tab to display the HR Executive Dashboard — Global Workforce Costs page.
Note:
Whenever departments are displayed in graphs in OTBI Enterprise for HCM Cloud Service, you can select the department element or name in the graph to drill down to view that department in detail. In the organization detail screen, you can explore that selected department and it's child departments in detail, or select the Back to Global Summary link to return to the top-level company view.
How do I read the Global Workforce Costs Sparkline Tiles?
The Global Workforce Costs sparkline tiles enable you to quickly assess key workforce cost metrics.
The numbers within the tiles display the current data for the month you select in the Time dashboard prompt list. The sparkline graphs display data for the 12 months prior to the month you select.
This sparkline contains the following tiles:
-
Total Spending — Total payroll balance amount.
-
Salaries — Total annual base salaries amount.
-
Overtime — Total amount of overtime pay.
-
Cost per Worker — Total payroll cost divided by the total headcount for the same period.
-
Cost of Attrition — Cost of attrition based on the assumption that the cost to replace a worker is 125% of the worker's annual salary.
-
Leave Liability — Total calculated cost of employee leave accrued, but not taken.

With these metrics, you can pinpoint total payroll spending and trends, as well as costs for key categories like salaries and overtime. The Cost of Attrition metric enables you to understand how much attrition costs the organization. The Leave Liability metric enables you to understand the cost of untaken leave.
How do I read the Workforce Costs Report?
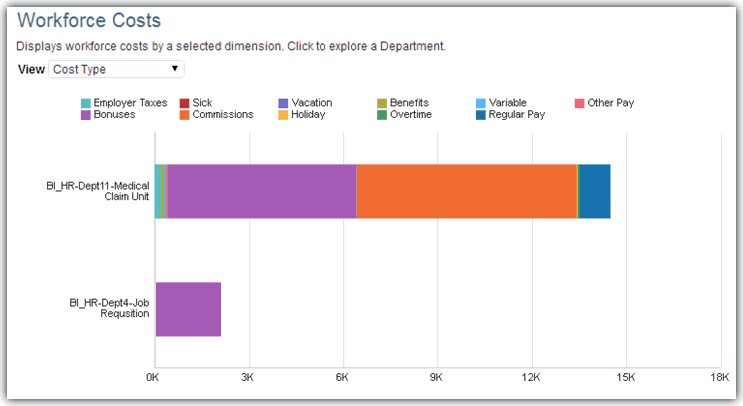
The following image shows an example of the Workforce Costs report metrics displayed by cost type. The Workforce Costs report enables you to see workforce costs from a variety of angles.
In this example, you can see that the Medical Claim Unit department spends significantly more on bonuses than the Job Requisition department. Understanding the proportion of spending on various payroll categories enables you to identify which departments may have higher costs due to taxes, overtime, or other pay components. You can use this information during strategic workforce planning sessions to determine the right mix of full and part time workers, as well as pinpoint the geographies from which to source future employees based on the total cost of employment.
You can change the perspective of the data displayed in the report by selecting one of the following view types in the View list:
-
Cost Type — Costs classified by expenditure type.
-
Country — Costs by country location.
-
Worker Type — Costs by worker classification.
-
Salary Basis — Costs by salary basis.
-
Department Level — Costs by department level within the organization's hierarchy.
-
Employment — Costs for full-time employees.
To drill down for more details on a department:
-
Click in a bar, or on a bar heading label in the chart to drill down into the department details.
-
Click the Back to Global Summary link to return to the Global Workforce Health Summary page or continue to analyze this department level by the topics displayed in the tabs at the top of the HR Executive Dashboard.
How do I read the Five-Year Trend Report?
The following image shows an example of the Five-Year Trend report metrics. You use this report to examine trends in payroll costs over the past five years.
This report contains the following metrics:
-
Balance Amount — Payroll balance by year.
-
Year — Year in which the payroll balance is tracked.
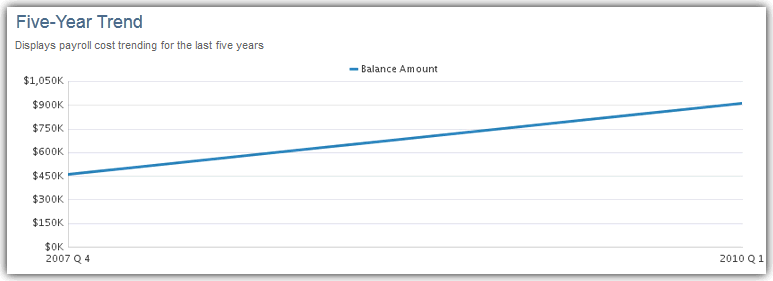
With these metrics you can see that your workforce costs have been steadily on the rise. You can use this information as important context for strategic planning and further analysis of costs at the corporate and department levels.

