1 Evaluating Global Workforce Health
This tutorial shows you how to evaluate the overall health of your workforce.
You want to see a high level view of how well your workforce is doing for a particular month as well as trends over the past 12 months.
Use the sparkline tiles and reports in the HR Executive Dashboard — Global Workforce Health Summary page to help you determine the overall health of your workforce.
To view the HR Executive Dashboard — Global Workforce Health Summary page:
-
Launch the OTBI Enterprise for Human Capital Management Cloud Service URL provided by your administrator.
-
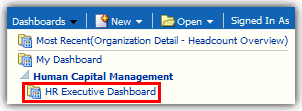
From the Dashboards menu, expand Human Capital Management, and then select HR Executive Dashboard.
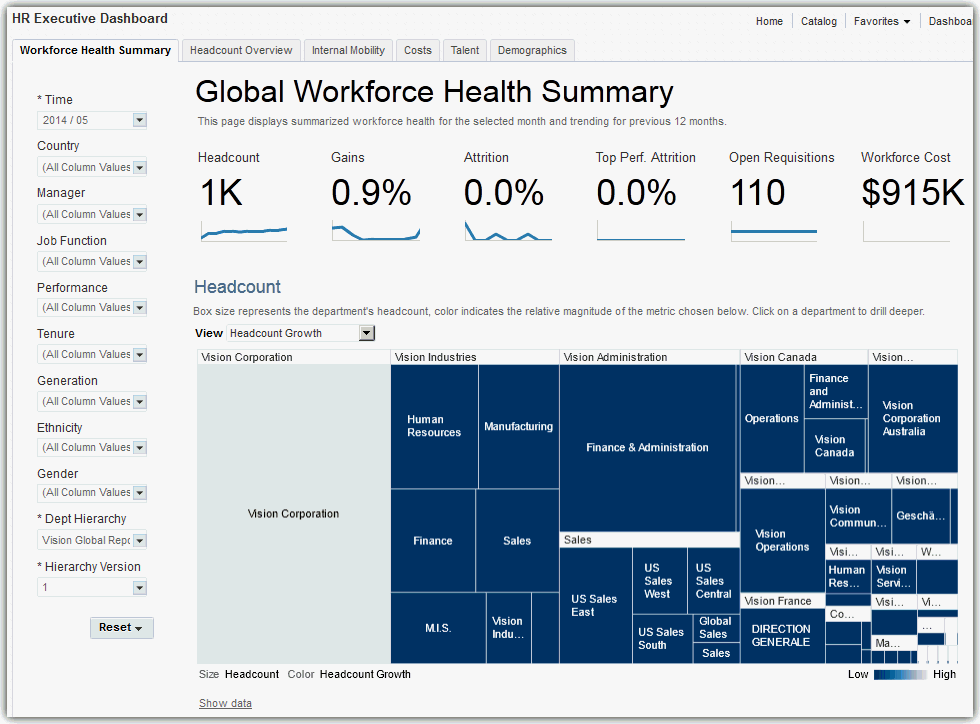
The HR Executive Dashboard — Global Workforce Health Summary page is displayed.
-
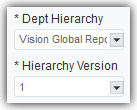
In the left pane on the dashboard page, verify that the Department Hierarchy and Hierarchy Version dashboard prompt list values are set correctly. This step ensures that the data displayed on the page is accurate.
If you are uncertain which values to select, consult with your OTBI Enterprise for HCM Cloud Service implementer or administrator. Your implementer or administrator can set these values to default to the correct selections.
Note:
Whenever departments are displayed in graphs in OTBI Enterprise for HCM Cloud Service, you can select the department element or name in the graph to drill down to view that department in detail. On the organization detail page, you can explore the selected department and it's child departments in detail, or select the Back to Global Summary link to return to the top-level company view.
How do I read the Global Workforce Health Sparkline Tiles?
The Global Workforce Health sparkline tiles enable you to quickly assess key overall workforce health metrics.
The numbers within the tiles display the current data for the month you select in the Time dashboard prompt list. The sparkline graphs display data for the 12 months prior to the month you select.
This sparkline contains the following tiles:
-
Headcount — Total number of employees, including contingent, temporary, and inactive employees.
-
Gains — New hires as a percentage of the total workforce.
-
Attrition — Percentage of employees that are in terminated status.
-
Top Performer Attrition — Percentage of terminated employees that were also classified as top performers.
-
Open Requisitions — Total number of open requisitions. This value requires integration to Taleo Recruiting, or external recruiting data loads.
-
Workforce Cost — Total payroll balance amount. This value requires integration to Oracle Fusion Payroll or external payroll data loads.

With these metrics, you can see that your workforce is growing, with little attrition, but you have over 300 open positions. You can use this information to work with your recruiters to create a strategy to fill these positions quickly.
How do I read the Headcount Report?
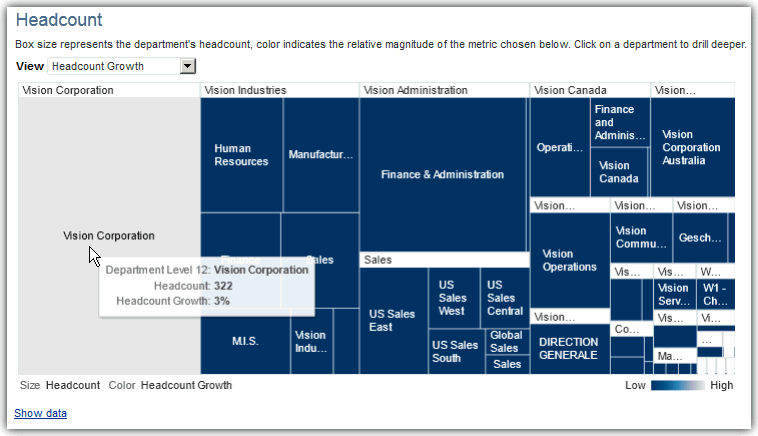
The following image shows an example of the Headcount report with headcount growth metrics displayed. The boxes in the treemap represent departments within the hierarchy. The size and color of the boxes indicate the relative magnitude of the selected metric. The visual properties of this treemap enable you to see, at a glance, how your departments compare to each other.
In this example, it looks like the Vision Corporation has the highest headcount growth rates at 3%. This information helps you to understand which organizations within the company are growing rapidly, and which ones may be declining in headcount.
You can change the perspective of the data displayed in the report by selecting one of the following view types in the View list:
-
Headcount Growth — Employees hired and deployed.
-
Attrition Rate — Employee turn over rate.
-
Voluntary Attrition Rate — Employee voluntary turn over rate.
-
New Hires — New hire employee count.
-
Open Requisitions — Total number of open requisitions. This value requires integration to Taleo Recruiting, or external recruiting data loads.
-
Payroll Cost Per Employee — Payroll balance amounts per employee.
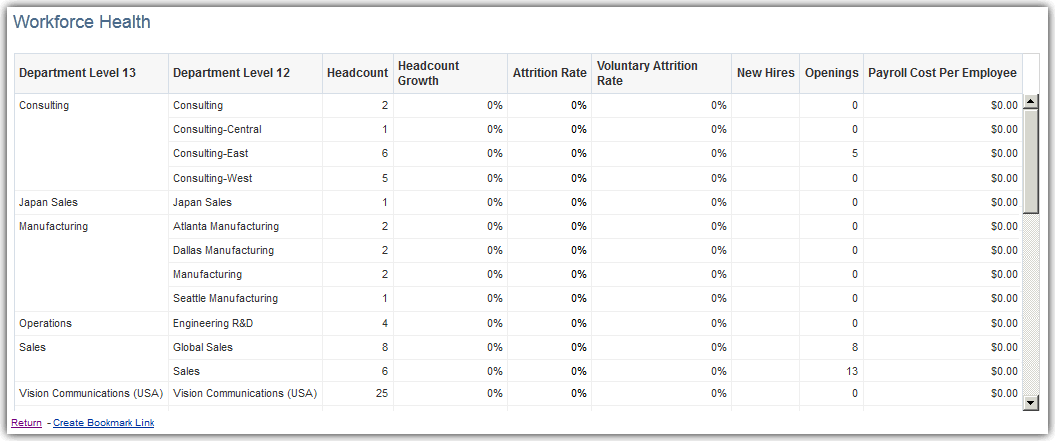
You can optionally click the Show data link at the bottom of the report to display the treemap in a detailed table format as shown in the following image.
To drill down for more details on a department:
-
Click in a department box, or on a department heading label in the treemap, and select Explore this Department to drill down into the department details.

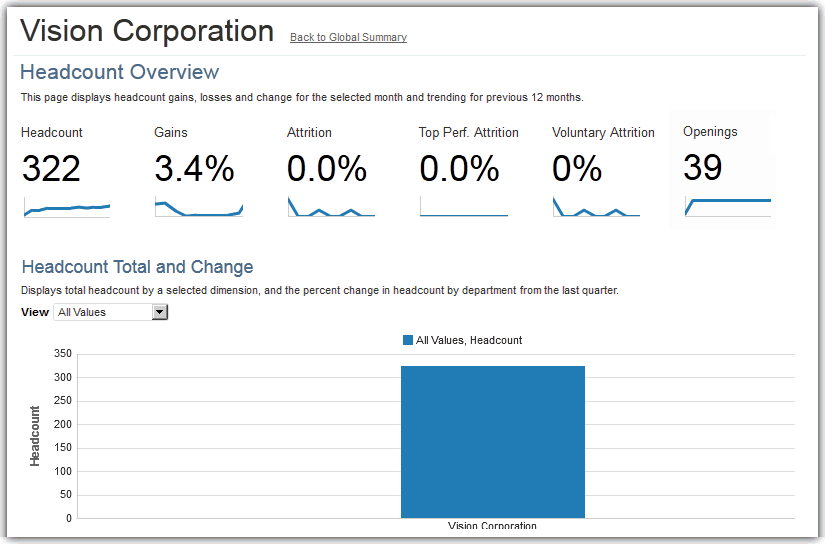
The image below shows an example of a drill down into the detailed headcount metrics for the Vision Corporation department. After drilling down to the next lower department in the hierarchy, you can analyze the department and it's child departments by the same topics you work with at the global corporate level. This enables you to identify opportunities and issues at the lower levels of the organization.
-
Click the Back to Global Summary link to return to the Global Workforce Health Summary page or continue to analyze this department level by the topics displayed in the tabs at the top of the HR Executive Dashboard.
How do I read the Five-Year Trends Report?
The following image shows an example of the Five-Year Trends report which displays key workforce trends over the last five years.
In this example, it looks like the overall headcount rates are flat, attrition is down, and your hiring rates are low. You can use this information to get a broader view of your workforce health over the last five years and provide context to strategic planning activities and discussions.
The report contains the following trend metrics:
-
Headcount — Percentage of employees deployed.
-
Attrition — Percentage of terminated employees segmented by top performers and all other employees.
-
Open Requisitions and Hires — Number of open requisitions and hires.
-
Workforce Costs — Payroll balance amount.


