2 Evaluating Headcount
This tutorial shows you how to view and evaluate headcount.
You want to see a high level view of headcount gains, losses, and change for a particular month as well as trends over the past 12 months.
Use the sparkline tiles and reports in the HR Executive Dashboard — Global Headcount Overview page to help you plan your headcount and anticipate workforce trends.
To view the HR Executive Dashboard — Global Headcount Overview page:
-
Launch the OTBI Enterprise for Human Capital Management Cloud Service URL provided by your administrator.
-
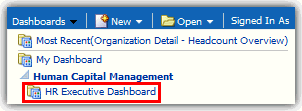
From the Dashboards menu, expand Human Capital Management, and then select HR Executive Dashboard.
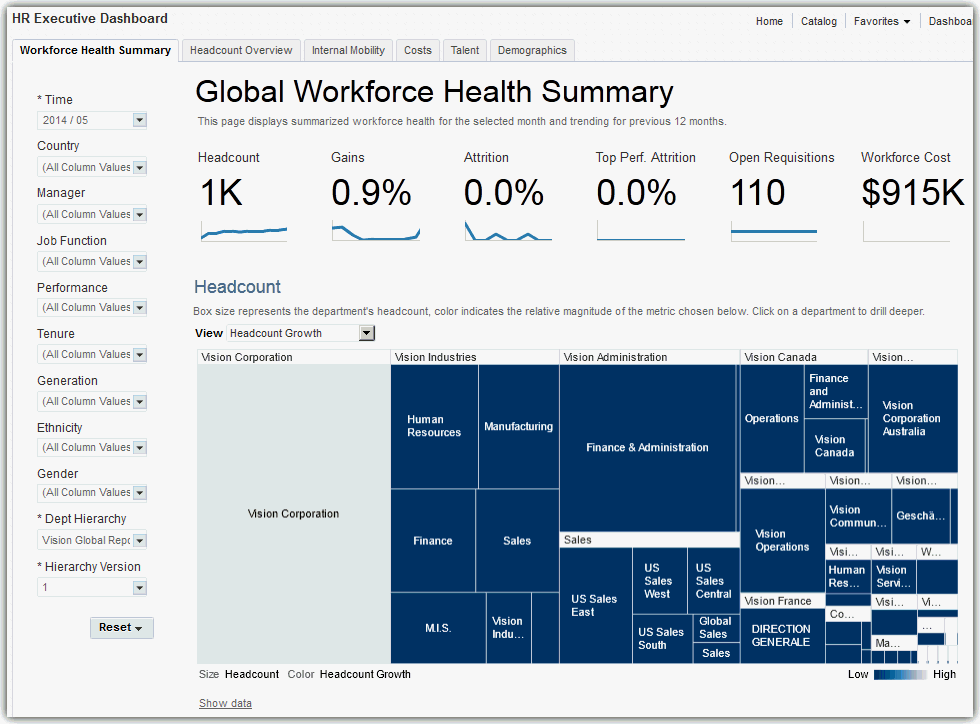
The HR Executive Dashboard — Global Workforce Health Summary page is displayed.
-
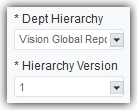
In the left pane on the dashboard page, verify that the Department Hierarchy and Hierarchy Version dashboard prompt list values are set correctly. This step ensures that the data displayed on the HR Executive Dashboard is accurate.
If you are uncertain which values to select, consult with your OTBI Enterprise for HCM Cloud Service implementer or administrator. Your implementer or administrator can set these values to default to the correct selections.
-
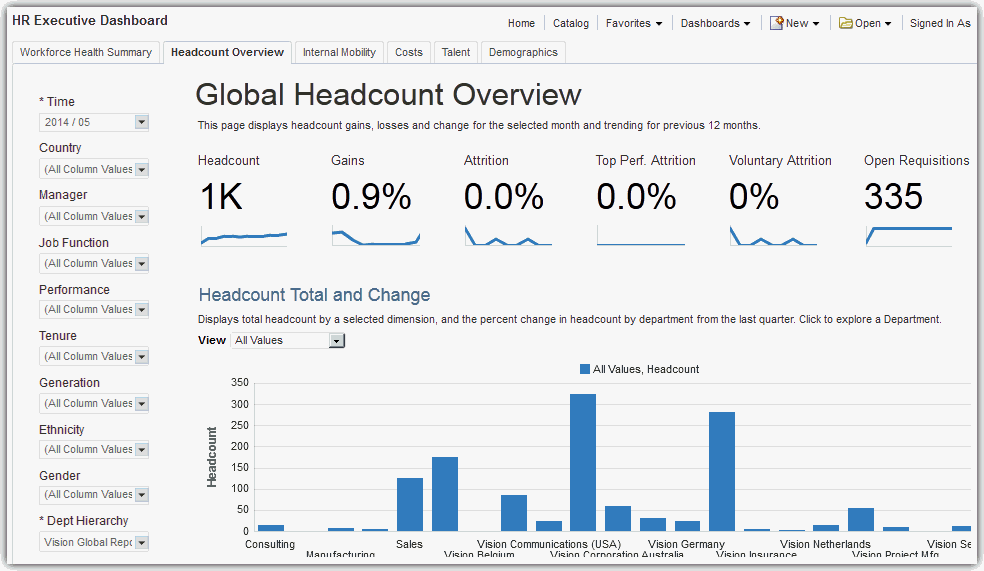
Select the Headcount Overview tab to display the HR Executive Dashboard — Global Headcount Overview page.
Note:
Whenever departments are displayed in graphs in OTBI Enterprise for HCM Cloud Service, you can select the department element or name in the graph to drill down to view that department in detail. On the organization detail page, you can explore the selected department and it's child departments in detail, or select the Back to Global Summary link to return to the top-level company view.
How do I read the Global Headcount Overview Sparkline Tiles?
The Global Headcount Overview sparkline tiles enable you to quickly assess key headcount metrics.
The numbers within the tiles display the current data for the month you select in the Time dashboard prompt list. The sparkline graphs display data for the 12 months prior to the month you select.
This sparkline contains the following tiles:
-
Headcount — Total number of employees, including contingent, temporary, and inactive employees.
-
Gains — New hires as a percentage of the total workforce.
-
Attrition — Percentage of employees that are in terminated status.
-
Top Performer Attrition — Percentage of terminated employees that were also classified as top performers.
-
Voluntary Attrition — Total number of employee resignations.
-
Open Requisitions — Total number of open requisitions. This value requires integration to Taleo Recruiting, or external recruiting data loads.

With these metrics, you can see that your headcount change percentages are fairly flat, but you have over 300 open positions. You can use these metrics to formulate a strategy to hire new talent.
How do I read the Headcount Total and Change Report?
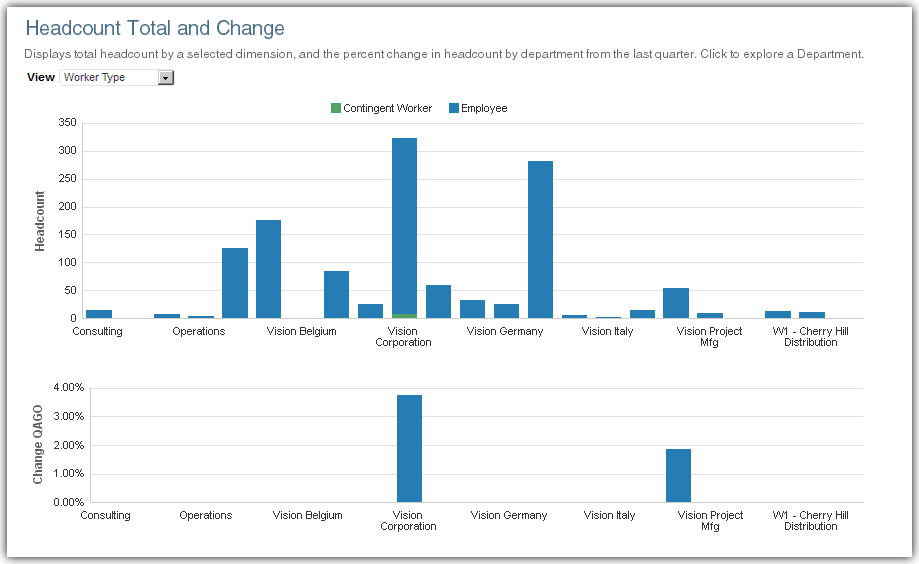
The following image shows an example of the Headcount Total and Change report metrics displayed by worker type.
In this example, you can see that most of your headcount is classified as employees. The Vision Corporation department comprises the largest proportion of growth, including what may be growth in contingent workers. You can use this information to determine which organizations are growing rapidly, and which ones may need further support from the HR organization to assist with employee development and strategic planning.
You can change the perspective of the data displayed in the report by selecting one of the following view types in the View list:
-
All Values — All headcount.
-
Performance Band — Headcount by performance band.
-
Worker Type — Headcount by worker classification.
-
Job Family — Headcount by job category.
To drill down for more details on a department:
-
Click in a bar, or on a bar heading label in either charts to drill down into the department details.
-
Click the Back to Global Summary link to return to the Global Workforce Health Summary page or continue to analyze this department level by the topics displayed in the tabs at the top of the HR Executive Dashboard.
How do I read the Gains Report?
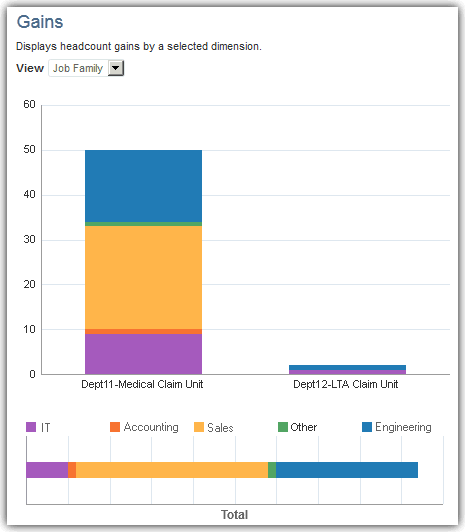
The following image shows the Gains report with headcount gain metrics displayed by recruiting source.
In this example, it looks like the majority of your headcount gains are in the Sales job family. This information provides context to your discussions with department leaders about the types of skills they are acquiring, how HR can assist the organization to grow talent from within, and how best to evaluate quality of hire for these key jobs.
You can change the perspective of the data displayed in the report by selecting one of the following view types in the View list:
-
Job Family — Headcount gains by job family.
-
Country — Headcount gains by country location.
-
Pay Grade — Headcount gains by pay grade.
How do I read the Losses Report?
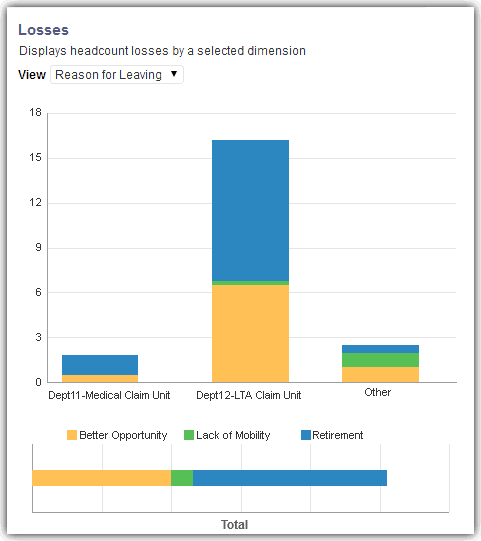
The following image shows the Losses report with headcount loss metrics displayed by the reason for leaving.
In this example, you can see that most of the employees you lost either retired or found better opportunities outside the company. You can use this information to investigate further and plan retention strategies to prevent expensive headcount losses in the future.
You can change the perspective of the data displayed in the report by selecting one of the following view types in the View list:
-
Reason for Leaving — Headcount loss by reason for leaving.
-
Job Family — Headcount loss by job family.
-
Country — Headcount loss by country location.
-
Performance — Headcount loss by performance rating.
-
Pay Grade — Headcount loss by pay grade.

