Work with Preconfigured and Custom Dashboards on the Console Page
For overview information, see Preconfigured Dashboards and Custom Dashboards.
To work with the dashboards for a business process:
- Navigate to the console page for the business process in either of the following
ways:
-
On the Consoles page, click the model (business process) of interest to display its console page.
- (Insight Administrator only) On the Models page, click
 for a model, then View Console to open the associated
console page.

-
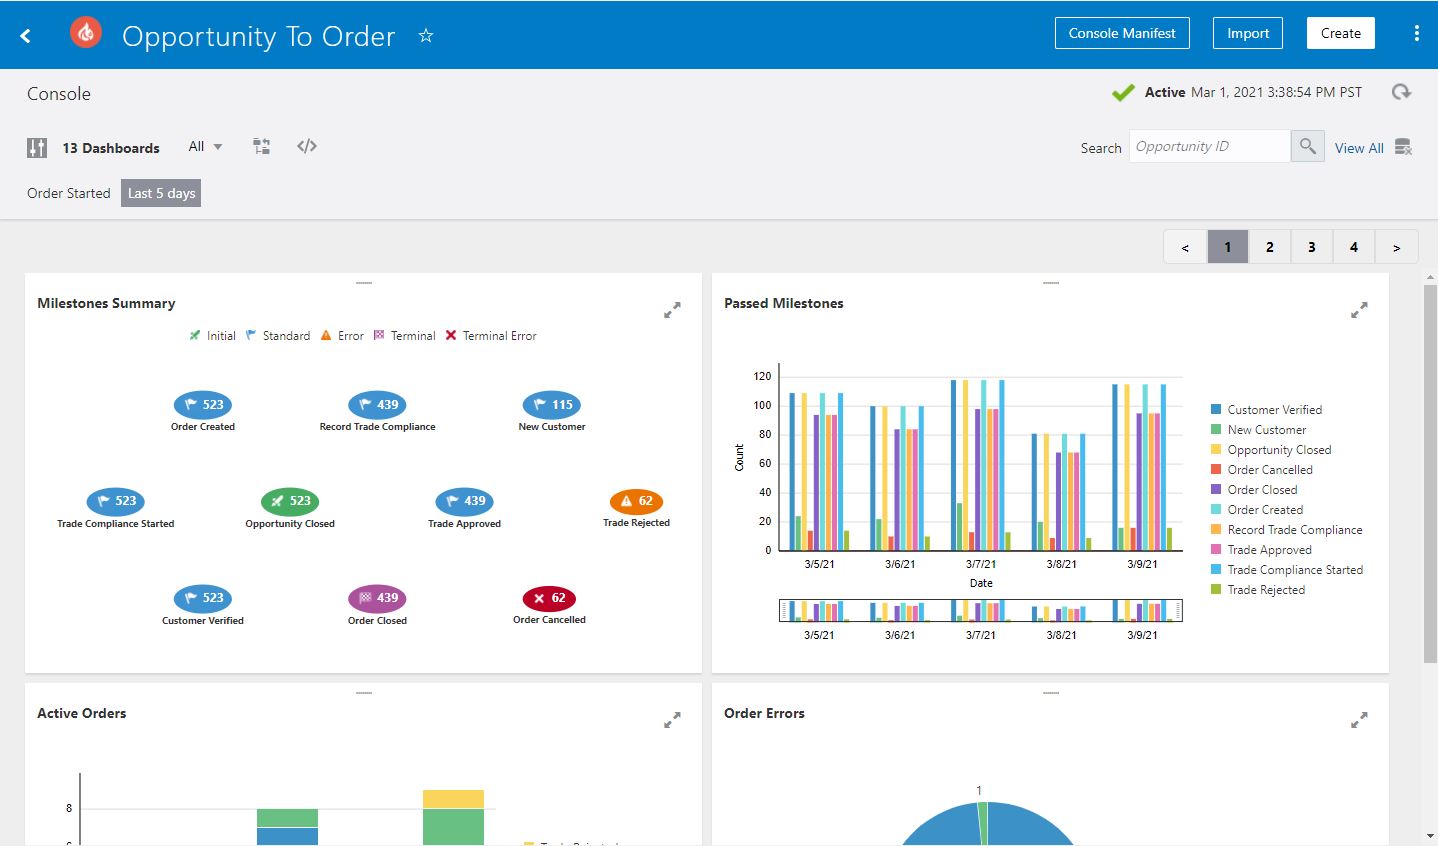
- On the console page, review the dashboards for the business process and perform any of the following actions:
-
Click Console Manifest to find the IDs for console components. See Generate a Console's Manifest.
-
Click Import to import dashboards that were previously exported with this business process. See Import Dashboards.
-
Click Create to create custom dashboards. See Create Custom Dashboards.
- Click Details
 to display the Console Details. This area
displays the model's icon, model description, and the identifying terms for siingle
and multiple business transactions, which were defined when the model was
created.
-
Click Search
 to search for a chart by full or partial chart name.
-
Click Expand filters
 to set lifecycle filters or filterable indicators to narrow or expand your
results. See Filter Dashboards.
-
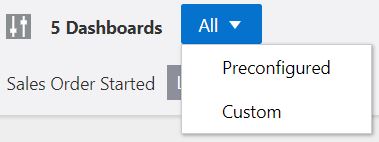
Select from the Dashboard Type list to display dashboards of the selected type:
-
All
-
Preconfigured
-
Custom

-
-
Click Rearrange Dashboards
 to change the order that dashboards appear on the console page. See Rearrange Dashboards.
-
Click Embed Dashboard
 to open the Embed Dashboards dialog. See Embed Insight Dashboards in Other Applications.
-
Enter a value in the Search field to search for specific business transactions (instances) based on the business transaction's unique identifier. Matching business transactions display in the Business Transactions dashboard. See Search for Business Transactions.

-
Click View All to view all business transactions on the Business Transactions dashboard, and drill down to more details. Business transactions from the last five days are displayed by default. See Work with the Business Transactions Dashboard.
-
(Visible only to the Insight Administrator) Click Purge
 to purge Insight metrics and events data for the console. See Purge Console Data for a Model.
-
Click Refresh
 to update the dashboards with the most recent business process data.
- For any dashboard, click Expand
 to display the dashboard in full page view. Click Close
 to return to the console view.
-
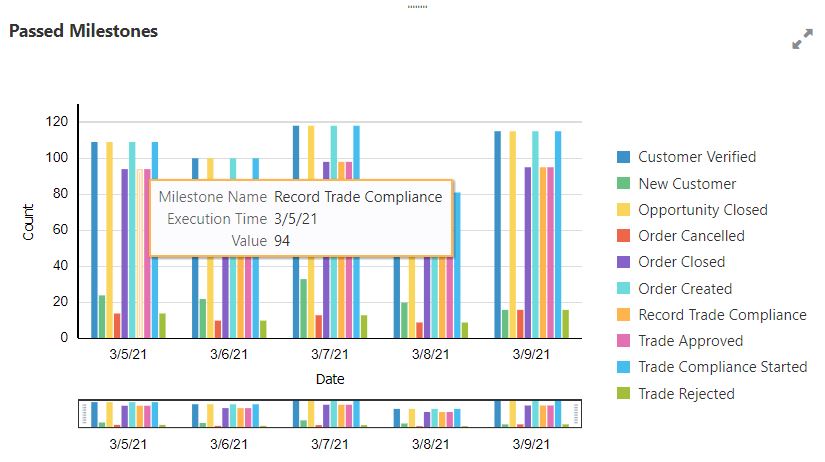
Hover your mouse over dashboards to view more details about the data.

- Double-click on a milestone in a dashboard to display the Business Transactions dashboard showing business transactions associated with that milestone:
-
Passed Milestones: Double-click any milestone bar to show the business transactions (instances) that have passed that milestone.
-
Milestones Summary: Double-click any milestone bubble to show the business transactions (instances) associated with the milestone.
-
Active Transactions: Double-click any business transaction bar to show the active business transactions. Because a business transaction state may change between the time the dashboard displayed and the time you clicked a bar, you may not see the same business transactions in the Business Transactions dashboard.
-
Transaction Errors: Double-click any slice on the pie chart to show the business transactions in Error state.
-
Avg. Transaction Completion Time: Double-click any bubble on the bubble chart to show the business transactions in Successful or Failed state, depending on the bubble you clicked.
-
Custom dashboards: Double-click any element that represents business transactions (such as a pie slice in a pie chart) to show the associated business transactions. See Create Custom Dashboards.
-
-