Deliverability Trends Dashboard
Note: This dashboard is available only to users with the Mobile Apps Analytics Manager role.
The Deliverability Trends dashboard provides an in-depth analysis of mobile app campaign deliverability. This dashboard will only display results from Push and In-App campaigns.
The following charts and tables are included:
- Bounce Rates By Sent Week chart
- Open & Active Rates By Sent Week chart
- Deliverability by Campaign report
To open the Deliverability Trends dashboard:
- Click
 Insight on the side navigation bar, and select Interactive Dashboards.
 - On the Analytics page, select the Mobile Apps tab and expand Deliverability.
- Click Deliverability Trends.
To select a date range:
- Select the date range from the Sent Date Range drop-down list.
- Click Apply.
Deliverability Trends dashboard overview
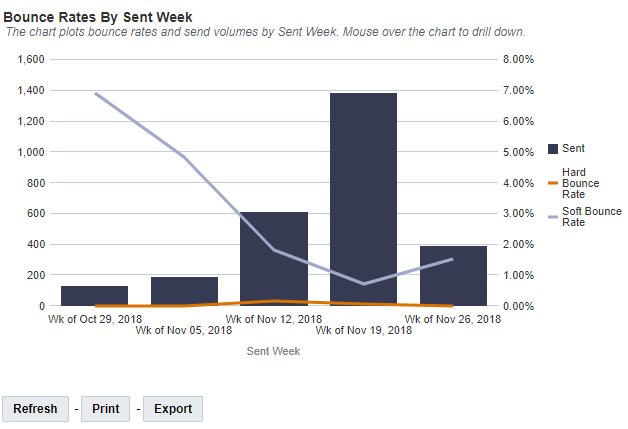
Bounce Rates By Sent Week chart
This chart plots the Hard Bounce Rate and the Soft Bounce Rate by Sent Week. The total number of sent notifications for each Sent Week is also displayed with a bar chart. Mouse over the chart to drill down to a specific Sent Week.
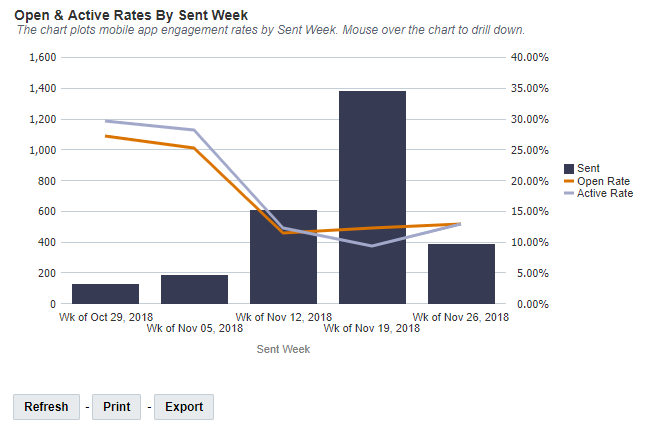
Open & Active Rates By Sent Week chart
This chart plots the Open Rate and Active Rate by Sent Week. The total number of sent notifications for each Sent Week is also displayed with a bar chart. Mouse over the chart to drill down to a specific Sent Week.
Deliverability by Campaign report
For each campaign, this report provides the following deliverability analysis summaries:
- Sent: Total number of sent notifications. Includes message center campaigns.
- Hard Bounces: The total number of hard bounces
- Hard Bounce Rate: Total Hard Bounces / Total Sends
- Soft Bounces: The total number of soft bounces
- Soft Bounce Rate: Total Soft Bounces / Total Sends
- Bounced: Number of bounced messages. This includes both hard and soft bounces. "Soft" bounces can occur due to many reasons: message payload issues, incorrect FCM or APNs credentials, Google or Apple server errors, and the like. "Hard" bounces result from the device user having uninstalled the app. Responsys detects app uninstalls through hard bounces. This may affect campaign reporting. Marketers may observe a spike in bounces for some campaigns. When there is a long interval between campaign launches, there is more time for app uninstalls to occur, which leads to more hard bounce errors. Marketers may view the App Uninstall report to see how hard bounces may have affected the total bounce rate.
- Bounce Rate: (Bounced / Sent) * 100%
- Delivered: Number of successfully delivered messages (that is, Sent - Bounced)
- Delivered Rate: (Delivered / Total Sent) * 100%. Includes message center campaigns.
- Opens: Number of notifications opened, including repeat opens. For message center messages, number of times users tap on the message to be deep linked to detailed promotional content.
- Open Rate: (Opens / Delivered) * 100%; for Message Center, (Opens / Sent) * 100%
- Actives: Number of recipients that had the app open and in the foreground when the Push message arrived.
- Active Rate: (Active / Delivered) * 100