SMS and MMS Dashboard
Note: This dashboard is available only to users with the SMS Analytics Manager role.
The SMS and MMS Interactive Dashboard provides an at-a-glance summary of sent Oracle Responsys SMS and MMS campaigns.
The charts on this dashboard help you:
- Trend SMS and MMS campaign performance metrics over time, and drill down on areas of interest
- Explore top performing campaigns by Click Rate, Delivered Rate, and Conversion Rate
- View top performing links and network carriers
- Explore the most popular keywords by number of received keywords
You can search and filter the charts by program, campaign, and channel.
To open the SMS and MMS Dashboard
- Click
 Insight on the side navigation bar, and select Interactive Dashboards.
 - On the Analytics page, select the SMS & MMS tab.
- From the main dashboard, you can access these additional dashboards and reports:
Learn more about the measures and dimensions available for the SMS and MMS channel.
Key Performance Metrics
The dashboard provides a quick overview of the following key performance indicators for the SMS and MMS channel:
- Sent: Number of sent messages
- Delivered Rate: (Delivered Messages / Total Messages Sent) * 100%
- Unique Click-Through Rate : (Unique Clicks / Delivered) * 100%
- Conversion Rate: (Converted / Delivered Links) * 100
- Revenue Per Message: Total Revenue / Total Messages Delivered
Learn more about these measures.
Charts on this Dashboard
The dashboard comprises the following charts.
Performance Trend
This chart is available for both SMS and MMS channels. You can select the channel from the Channel drop down list.
Trends performance metrics including Sent, Delivered, Clicks, and Conversions for a campaign.
The performance metrics can also be plotted against each other for a comparison over time. To do this, select the comparison from the drop down list.
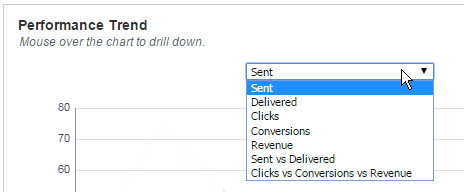
For a deeper analysis of the trend at any point on the chart, click the point to analyze the campaigns that contribute towards the trend.
Campaign Exploration
This chart is available only for the SMS channel.
The Campaign Exploration chart plots the SMS Campaigns by click-through rate and conversion rate. Each bubble represents an SMS campaign and the size of the bubble indicates the volume of delivered messages. The chart is useful in identifying the relative performance of campaigns. For example, campaigns with high click-through rates but low conversion rates might need more analysis to understand the cause of low conversions.
For a deeper analysis of a particular campaign, click a bubble to drill down to the detailed campaign data.
Top Performing Links by Clicks and Conversions
These charts are available only for the SMS channel.
The Top Performing Links by Clicks and Conversions charts show the top 10 SMS Campaigns by clicks and conversions, respectively.
To analyze the campaigns that are associated with a link, click the link name to drill down to the detailed data.
Network Carrier Breakdown
This chart is available only for the SMS channel.
The Network Carrier Breakdown shows the top 10 Network Carriers by the highest delivered rate of SMS messages.
Most Popular Keywords
This chart is available only for the SMS channel.
The Most Popular Keywords chart shows the keywords received from the targeted customers by volume of received messages. This helps identify the keywords with the most volume. This is particularly useful while running multiple keyword based SMS campaigns.