Email Campaign Designer - Analyze your campaign
Important: Campaign Designer is now generally available. It replaces the Campaign Workbook for all channels except MMS. This change does not affect Classic Campaigns.
To see how the Email Campaign Designer differs from the old email campaign workbook, see Email Campaign Designer changes. For a breakdown of the new Campaign Designer's visuals, see Email Campaign Designer visuals overview.
You can gain insight into your email campaign in a number of ways, such as choosing an option from the View drop-down or evaluating the Campaign performance metrics.
Learn more by watching the video!
With the Campaign Designer, you can analyze your campaign using some of the following options:
- Campaign performance metrics
- Campaign summary
- Monitor campaign
- Live report
- Insights
- Overlay report
- Campaign relationship
Campaign performance metrics
Note: This feature is only available for the email channel.
With the Campaign performance metrics panel, you can evaluate how your campaign is performing without needing to navigate away from the Campaign Designer. Gain insight into your campaign's revenue and rates, and evaluate these metrics over different periods of time (the last 7 days, 30 days, 90 days, or Today). You can also toggle between metrics for a proof or live launch if applicable. This panel only displays after a live launch or proof launch has begun or been scheduled, and metrics only display after a live or proof launch has begun.
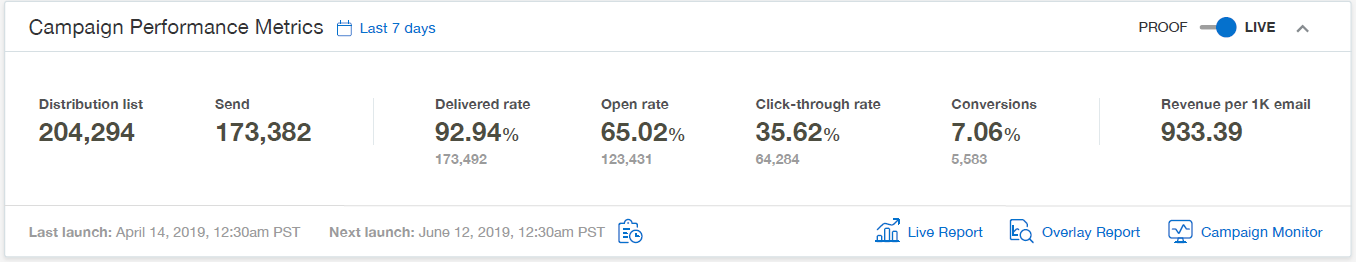
Metrics
Once the proof launch or campaign has launched, you will see the following metrics in the Campaign performance metrics panel:
- Distribution list: Number of email addresses on the distribution list at time of launch.
- Sent: Number of sent messages.
- Delivered: The number of successfully delivered messages.
- Delivered rate: (delivered / total emails sent) * 100%
- Opens: Number of email messages opened, including multiple opens.
- Open rate: (opens / delivered) * 100%
- Clicks: Count of total clicks, i.e. clicks on all links, including multiple clicks on the same link(s.) Unsubscribes do not register as clicks.
- Click-through rate: (total clicks / delivered) * 100%
- Conversions: Number of conversion actions.
- Revenue: Total revenue associated with a particular campaign launch.
- Revenue per 1K email: (total revenue / total delivered) * 1,000
Campaign summary
Use the Campaign Designer to create a printable view of your campaign summary. You can create a printable view of the campaign only if the campaign does not contain any errors. After clicking View > Campaign summary, the campaign summary opens in a new browser page.
Monitor campaign
To monitor all campaign launches or take action on a campaign launch, use the Campaign Monitor. You can access the Campaign Monitor by clicking Monitor campaign in the View drop-down or ![]() Monitor campaign in the Campaign performance metrics panel.
Monitor campaign in the Campaign performance metrics panel.
Note: The Campaign performance metrics panel only displays after a campaign is launched or scheduled.
Live report
The Live Report shows live data for one or more campaigns. Using the Live Report you can quickly review key metrics for your campaigns and monitor campaign performance. You can access the Live Report by clicking Live report in the View drop-down or ![]() Live report in the Campaign performance metrics panel. Learn more.
Live report in the Campaign performance metrics panel. Learn more.
Note: The Campaign performance metrics panel only displays after a campaign is launched or scheduled.
Insights
For active and closed campaigns, you can view the Campaign Analysis dashboard from the Campaign Designer. The Campaign Analysis dashboard helps you analyze key performance metrics of a selected campaign.
Overlay report
For active and closed campaigns, you can view the Overlay report from the Campaign Designer. The Overlay report is available for link-tracking campaigns. This report overlays Live Report data directly over a campaign, making it easier to correlate data directly to your messages. You can access the Overlay report by clicking Overlay report in the View drop-down or ![]() Overlay report in the Campaign performance metrics panel.
Overlay report in the Campaign performance metrics panel.
Note: The Campaign performance metrics panel only displays after a campaign is launched or scheduled.
Campaign relationship
Click Campaign relationship to access the Object Relationship Navigator, which is an interactive feature that enables you to visualize how campaigns are related to different objects (Filters, Profile Lists, and so on) in your account. Learn more about the Object Relationship Navigator.