Using the Concurrency Monitor Dashboard
The Concurrency Monitor dashboard gives you an overview of your account's concurrency data and available integrations. Use this dashboard to see concurrency data for different date ranges.
To set the date range, see Filtering Data on the Concurrency Monitor Dashboard.
Concurrency Monitor automatically shows data based on your account's governance type. For more, see Governance Types on Concurrency Monitor.
Accounts without Integration-Specific Limits
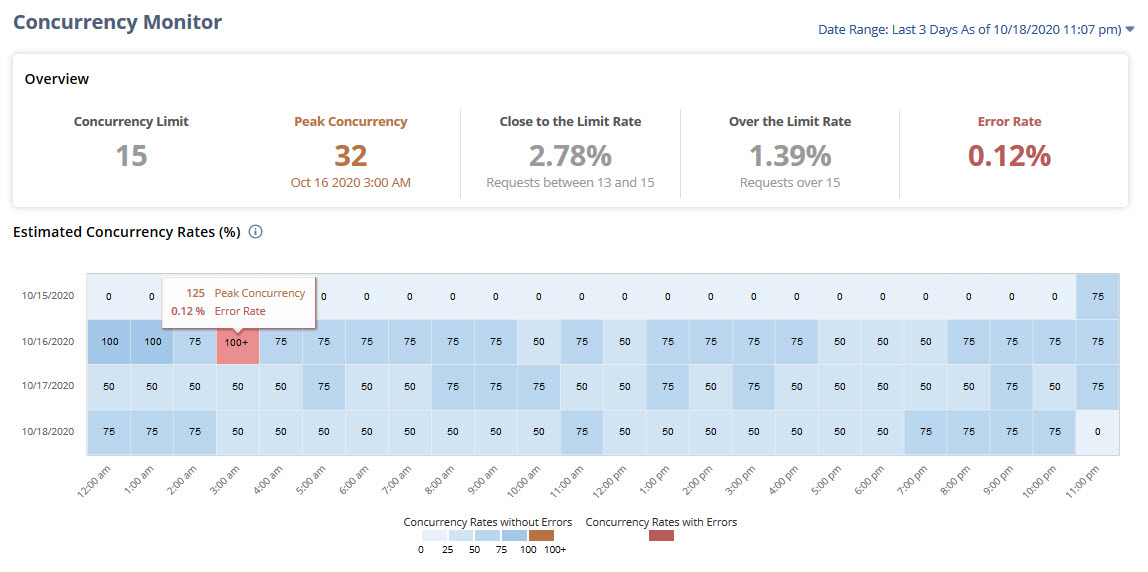
The following view appears for accounts without integration-specific limits:
Accounts with Integration-Specific Limits
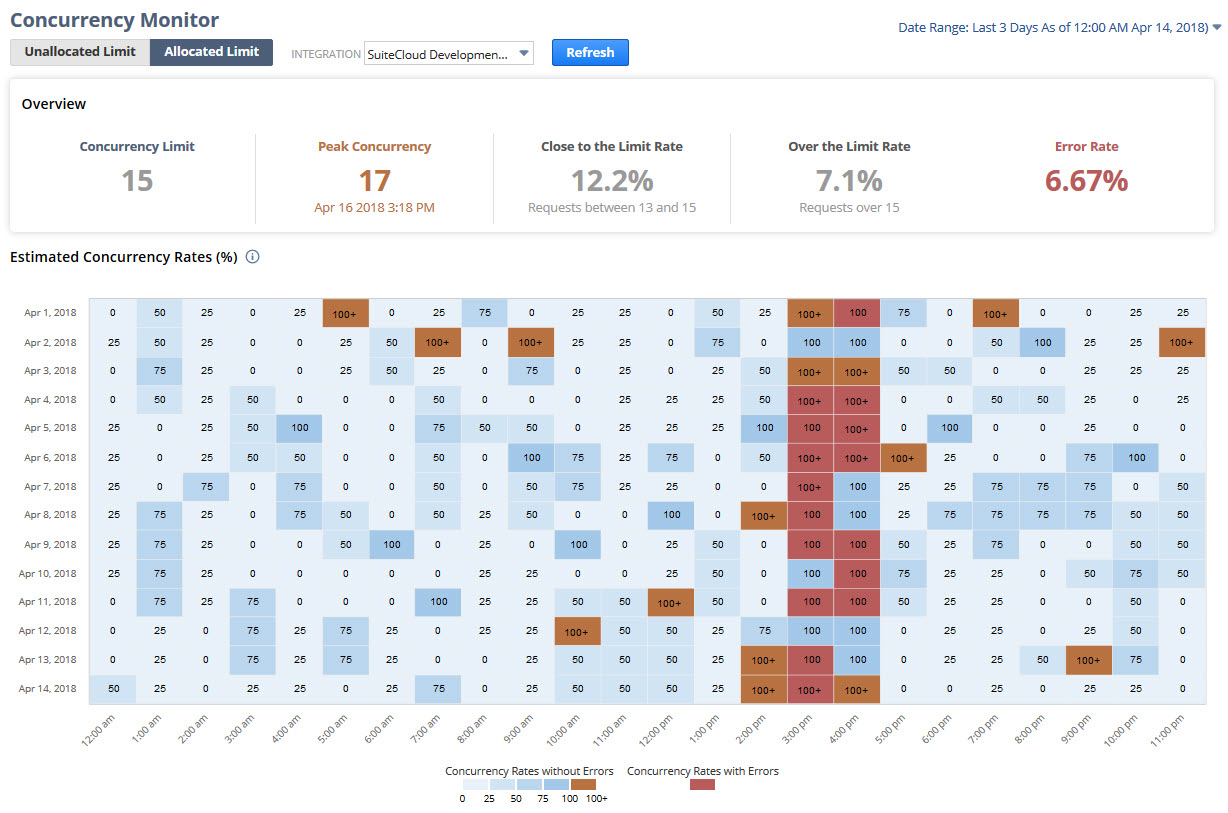
For accounts with integration-specific limits, Concurrency Monitor splits the data into allocated and unallocated limits. Click the Allocated Limit subtab to see data for integrations with a set concurrency limit.
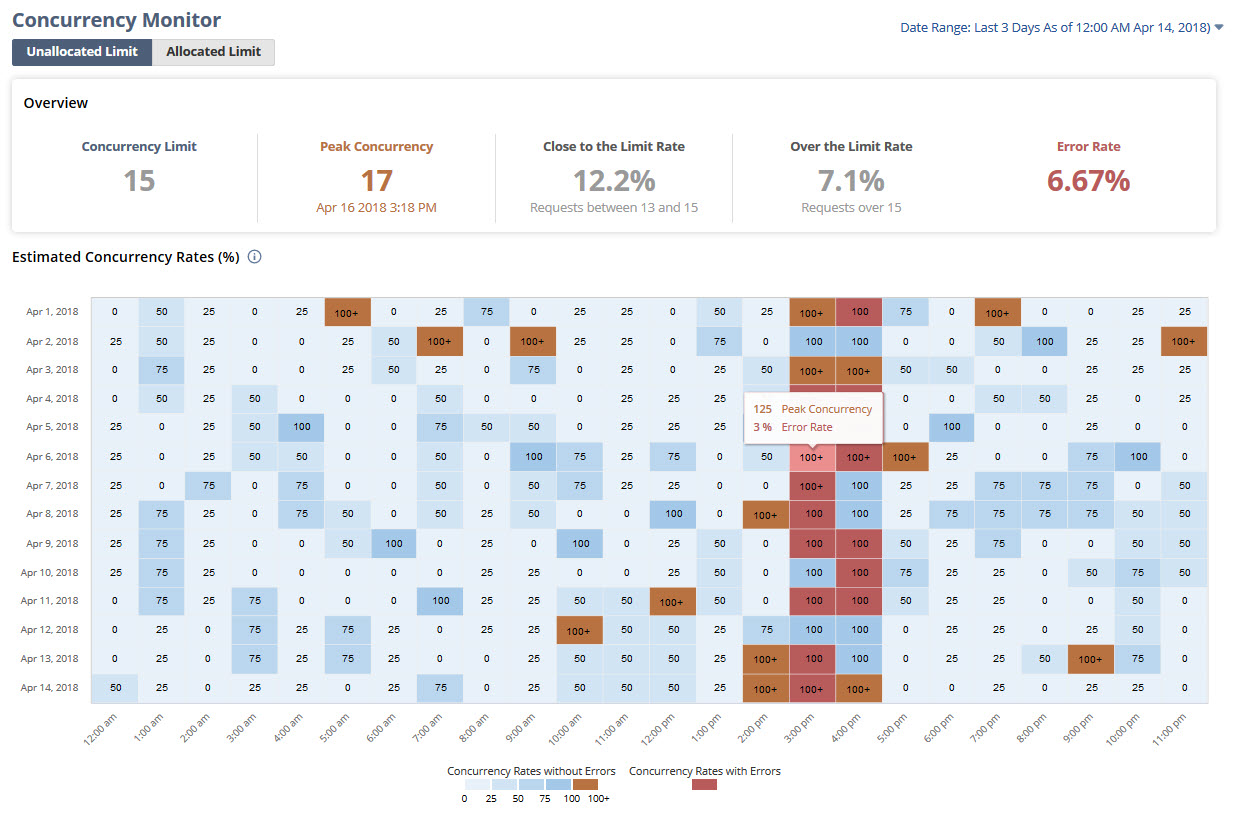
To see data for requests or integrations without a set concurrency limit, click the Unallocated Limit subtab:
To learn more about the dashboard portlets, see these help topics:
-
Viewing the Overview Portlet in the Concurrency Monitor Dashboard
-
Viewing the Estimated Concurrency Rates Chart in the Concurrency Monitor Dashboard
Filtering Data on the Concurrency Monitor Dashboard
You can choose from these date ranges to filter data on the Concurrency Monitor Dashboard:
-
Last 3 Days
-
Last 7 Days
-
Last 14 Days
-
Last 30 Days
To filter data on the Concurrency Monitor Dashboard:
-
Go to Customization > Performance > Concurrency Monitor.
-
On the upper corner of the Concurrency Monitor page, click the Date Range link.
-
Select a date range.
-
Click Apply.
-
To update all portlets with your changes, click Refresh at the top left of the dashboard.