Using the Concurrency Details Dashboard
The Concurrency Details dashboard lets you see the exact concurrency counts for each minute in the hour you clicked on in Concurrency Monitor.
Concurrency Details includes an overview for the selected time. To learn more, see Viewing the Overview Portlet in the Concurrency Details Dashboard.
The Concurrency Count chart shows which minutes are within the limit, over the limit, or have errors. The dotted red line marks the concurrency limit for the hour you're checking. Sometimes, you might see errors even when the concurrency count for a minute is below the limit. For more, see Viewing the Concurrency Count Chart in the Concurrency Details Dashboard.
Concurrency Details also lets you view logs about concurrency requests at specific times. To learn more, see Viewing Request Logs in the Concurrency Details Dashboard.
The dashboard shows data based on your account's governance type.
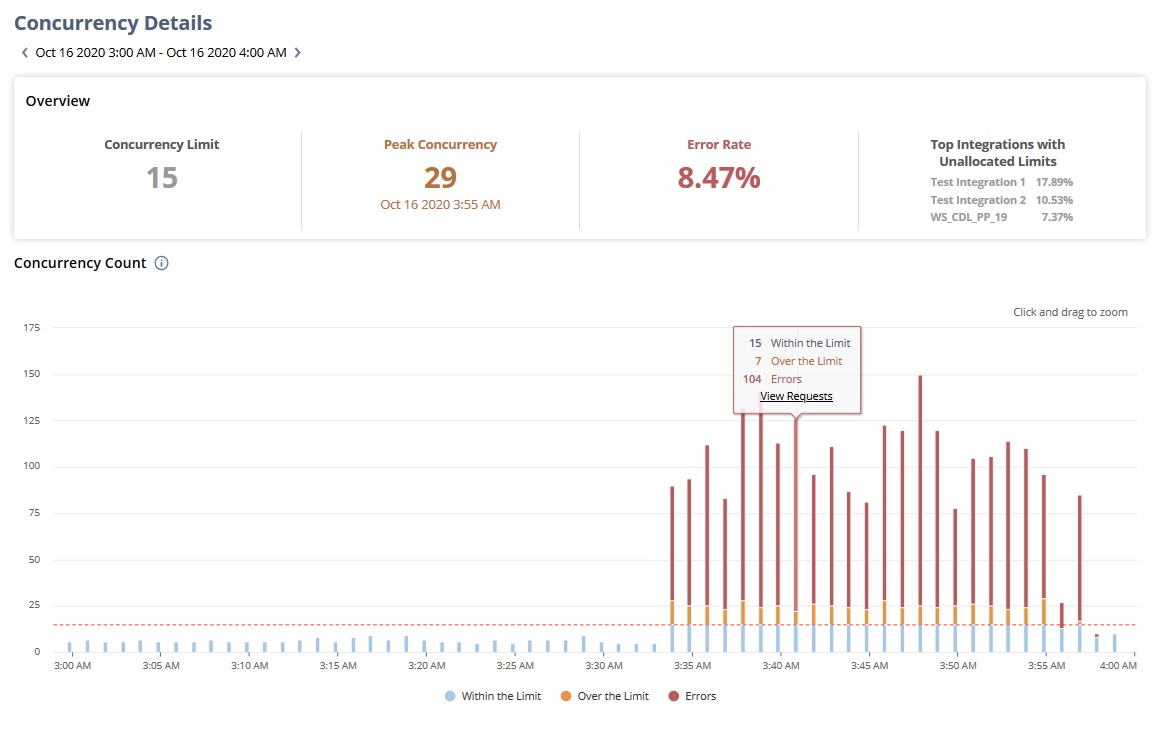
Accounts without Integration-Specific Limits
The following view appears for accounts without integration-specific limits:
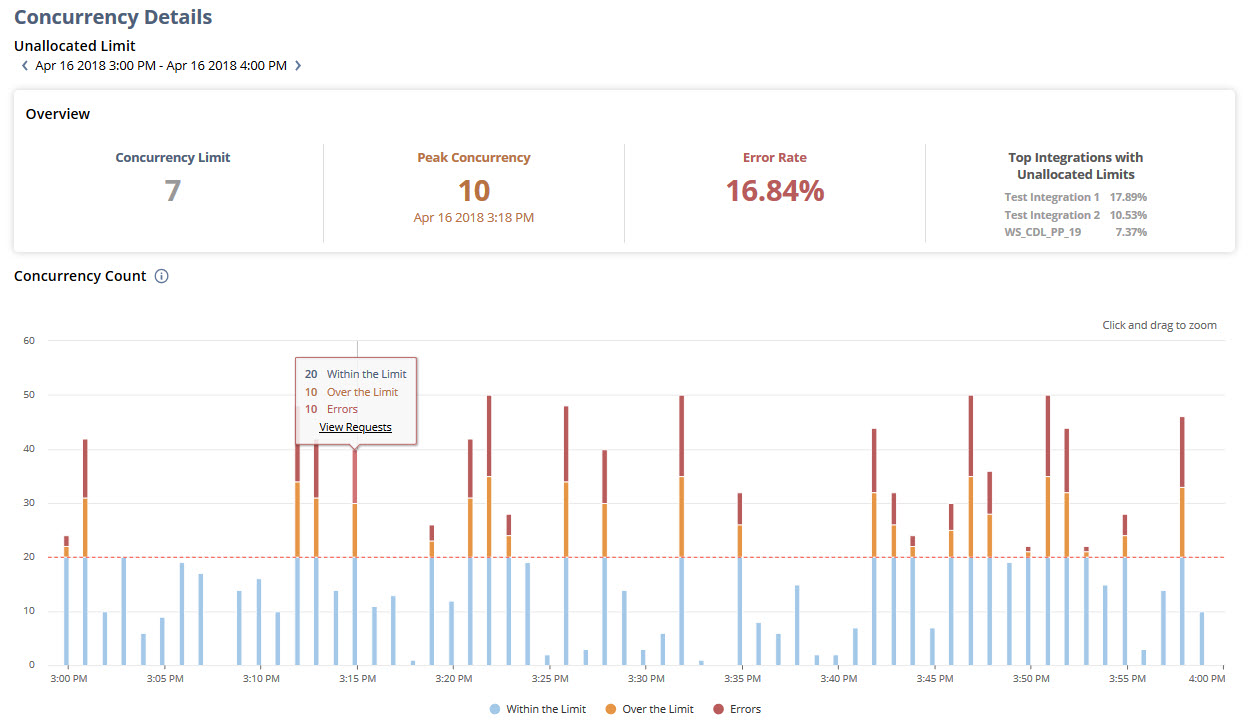
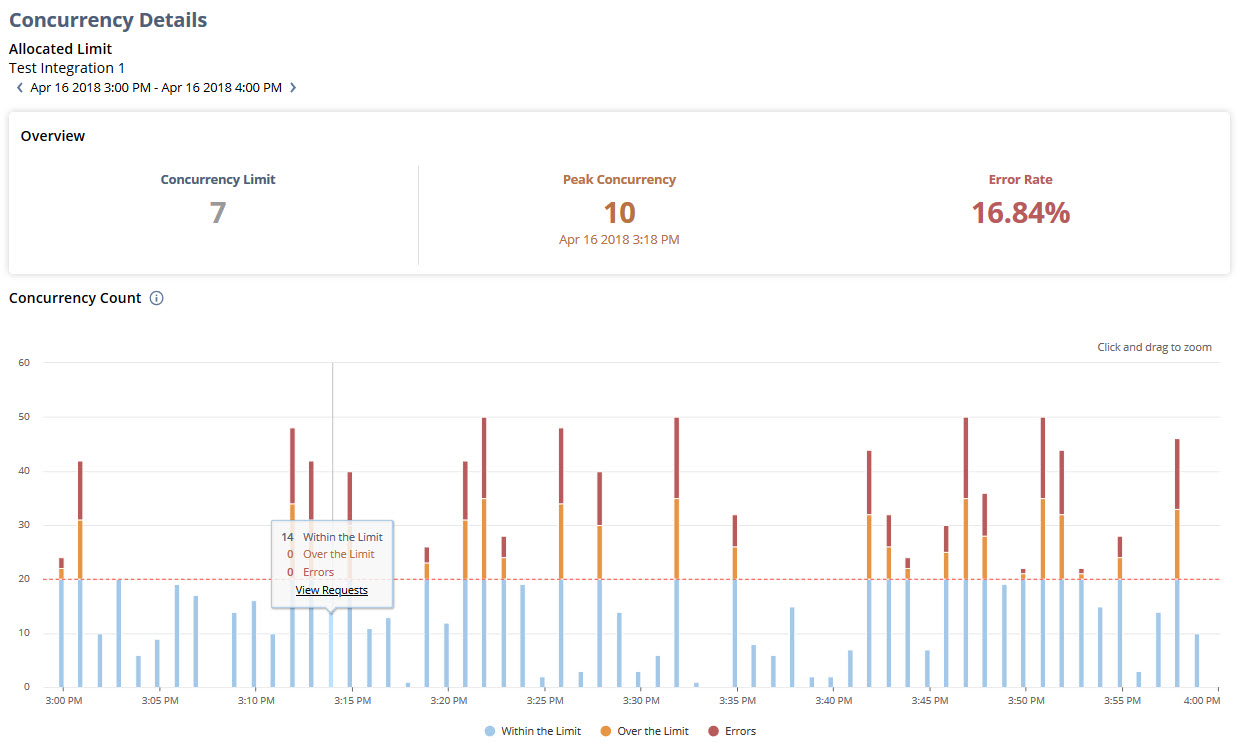
Accounts with Integration-Specific Limits
If you're viewing an account with integration-specific limits, Concurrency Details shows data filtered by the subtab and cell you clicked on in Concurrency Monitor. Before digging in, make sure you've picked the right subtab-Allocated Limit or Unallocated Limit-from Concurrency Monitor.
If you're in the Unallocated Limit subtab on the Concurrency Monitor dashboard, you'll see this view: