SuiteCommerce Performance Dashboard
SuiteCommerce Performance Dashboard is an analytical tool that gives you high-level performance data for your Commerce websites. It's a starting point for investigating potential issues, with links to more detailed dashboards in SuiteCommerce Application Performance Management (APM).
The following table points out and describes the dashboard's visual elements:
|
Item |
Information |
Description |
|---|---|---|
|
1 |
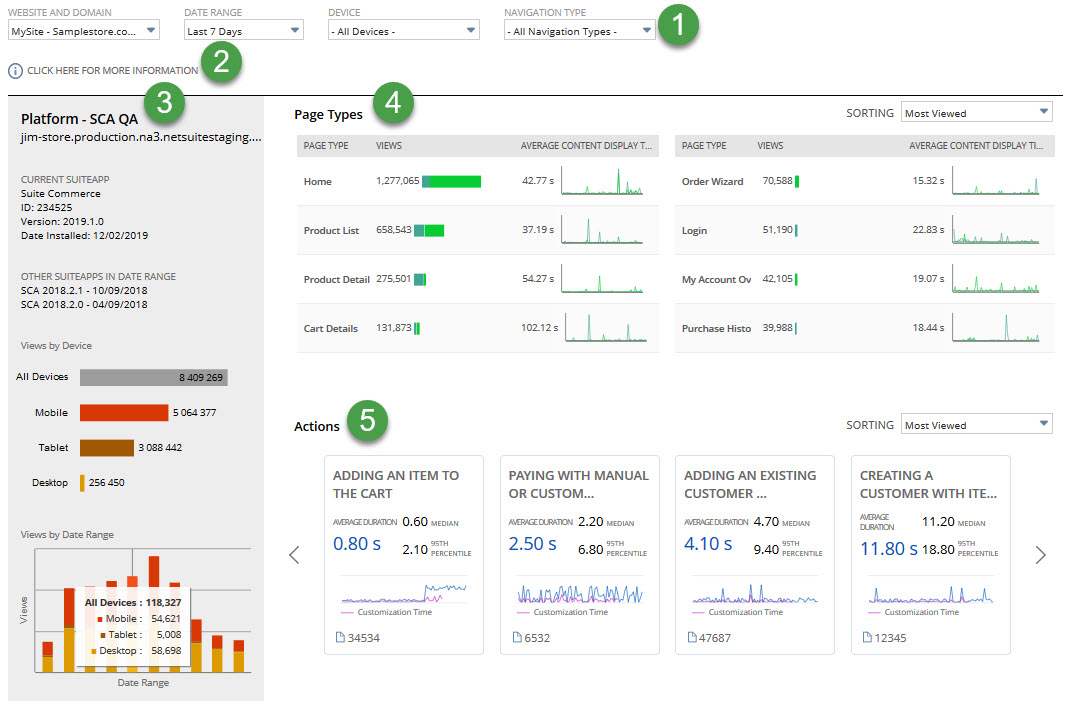
Filters |
Use these filters to choose what data appears on the dashboard:
|
|
2 |
Information Link |
The information icon and text link you to the dashboard's help topic. |
|
3 |
Domain Portlet |
This portlet shows general statistics and trends about your domain:
|
|
4 |
Page Type Portlet |
This portlet shows a table with details for up to eight page types:
To sort page types, go to the top right of the portlet and pick an option in the Sorting field:
|
|
5 |
Actions Portlet |
This portlet displays four tiles, each showing performance info for an action based on your selected filters. Click a tile to see diagnostic data for that action. For more information about the what's on each tile and action diagnostics page, see SuiteCommerce Action Diagnostics. To sort actions, go to the top right of the portlet and select from these options:
|