SuiteCommerce Page Type Diagnostics
SuiteCommerce Page Type Diagnostics is an analytical tool that provides high-level and detailed information about how a specific page type is performing on your website.
The following table points out and describes the dashboard's visual elements:
|
Item |
Information |
Description |
|---|---|---|
|
1 |
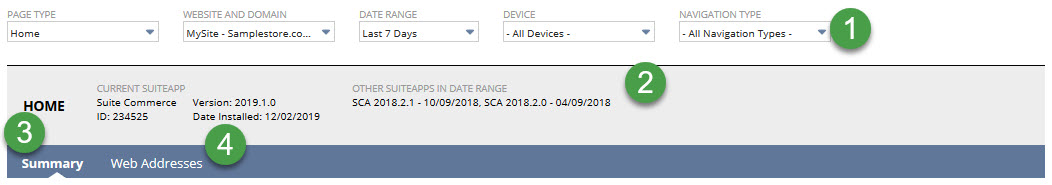
Filters |
Use these filters to pick what data appears on the dashboard:
|
|
2 |
Domain Banner |
The banner shows this general information about your selected page type:
|
|
3 |
Summary Tab View |
Click this view to see statistics and charts for the selected page type. For more information, see Summary View. |
|
4 |
Web Addresses Tab View |
Click this view to see a detailed table for each URL page of the selected type. For more information, see Web Addresses View. |
Summary View
SuiteCommerce Page Type Diagnostics includes a summary view.
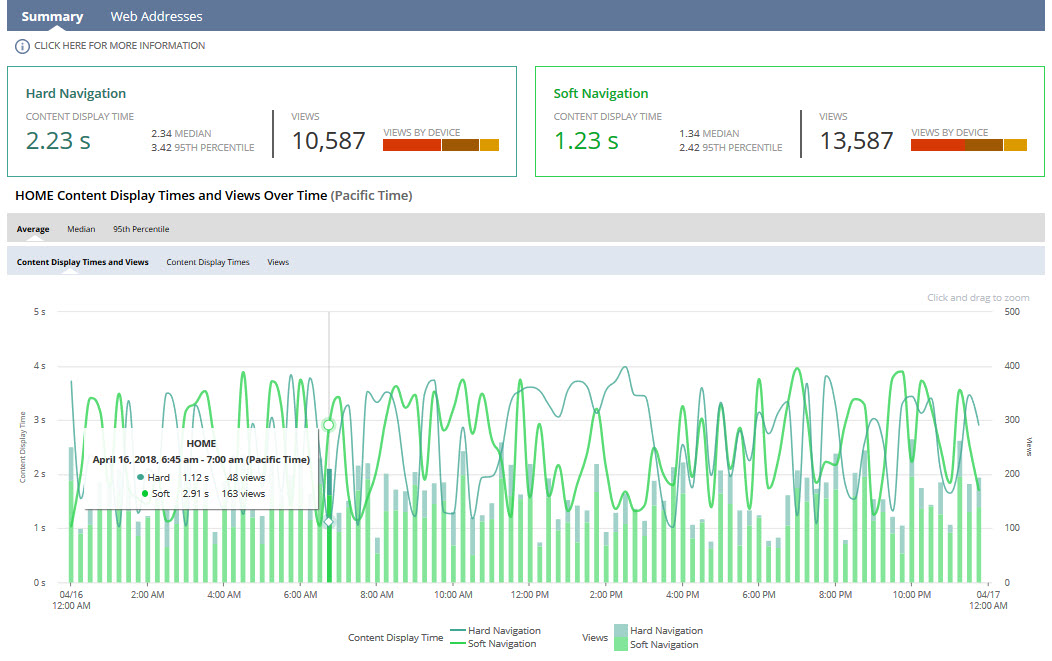
When clicked, this view shows the following statistics and charts about the selected page type:
-
Information Icon- Links to the dashboard help topic.
-
Navigation Type Banner- Shows content display time, total views, and device views for each navigation type.
-
Content Display Times and Views Over Time Charts- Charts are grouped under subtabs for average, median, and 95th percentile. Each tab includes these charts:
-
Content display times and views
-
Content display times
-
Views
To see content display times and view counts for each navigation type at a specific time, hover over a spot on the chart. Click to open the Page Type Views table, or drag over an area to zoom in on a specific range.
-
The Page Type Views table appears when you click a specific timing on the chart, showing details for instances from that time.
Use the Content Display Time field to filter the table's entries.
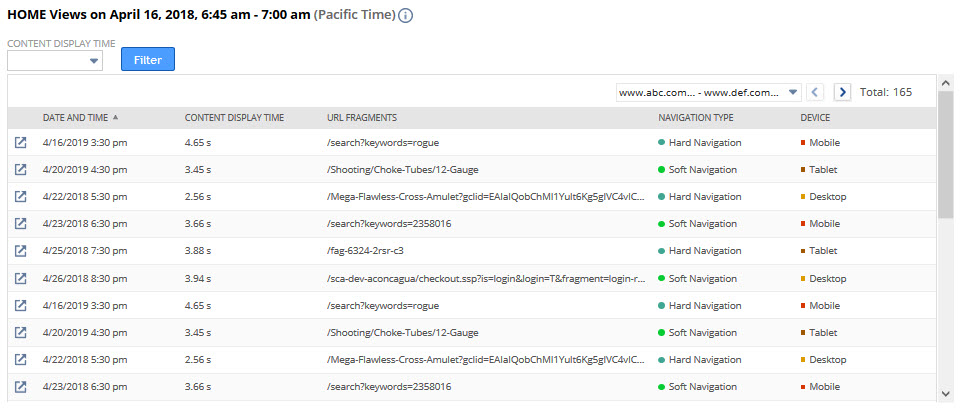
The following columns appear on the table:
-
Open Icon- Opens the Page View Details page, where you can see resources and their timings for when the user viewed the page. For more information, see SuiteCommerce Page View Details.
-
Date and Time- Shows when the user viewed the page.
-
Content Display Time- Shows the content display time for the page.
-
URL Fragments- Shows the web address visited.
-
Navigation Type- Shows how the user loaded the page.
-
Device- Shows the device used to load the page.
Web Addresses View
SuiteCommerce Page Type Diagnostics includes a summary view.
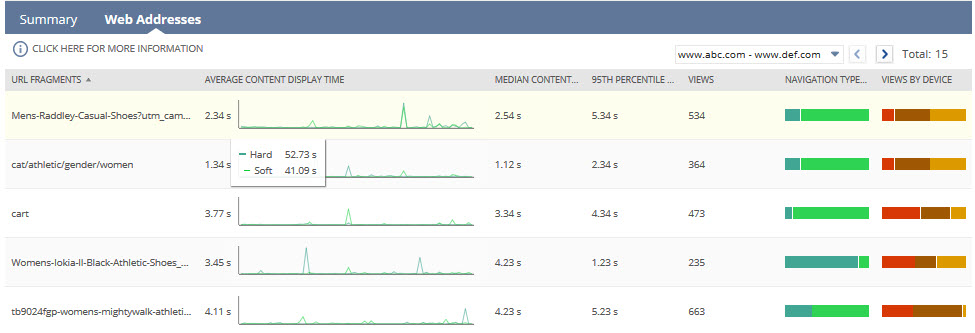
When clicked, this view shows a table with the following information:
-
URL Fragments- Shows the address of the web page.
-
Average Content Display Time (CDT)- Shows the average content display time for the URL or web address, plus a mini line chart for the date range.
-
Median Content Display Time- Shows the median content display time for the web address.
-
95th Percentile Content Display Time- Shows the 95th percentile content display time for the web address-95% of views were slower than this time, and 5% were faster.
-
Views- Shows the view count for the web address.
-
Navigation Type- Shows a horizontal bar chart for views by navigation type.
-
Views by Device- Shows a horizontal bar chart for views by device type.
When you click a row in the Web Addresses table, a portlet pops up with content display times and views over time charts, grouped into tabs for average, median, and 95th percentile, like in the summary view.
Click a point on the chart to open the corresponding page type views table, or drag to zoom in on a specific range.
When you click a specific timing on the chart, the Page Type Views table appears, showing details for instances from that time-similar to the table on the summary view.