Monitoring the PIX/PDQ Manager
The PIX/PDQ Manager includes a web-based management and monitoring application, the PIX Console. The PIX Console gives you the tools you need to monitor and view messages processed by the PIX/PDQ Manager, to monitor the ATNA audit repository, to maintain system and configuration information, and to view server log messages pertaining to the PIX/PDQ Manager.
The following topics provide information and instructions for monitoring the PIX/PDQ Manager using the PIX Console.
Setting the Session Timeout Duration
By default, if you login to the PIX Console and then leave it idle for 30 minutes, your session will automatically timeout and you will need to log back in to access the console. You can configure the length of time it takes to time out.
 To Set the Session Timeout Duration
-
On the server on which your GlassFish environment is located, navigate to glassfish-home/domains/domain-name/applications/j2ee-modules/pixconsole/WEB-INF.
-
Open web.xml in a text or XML editor.
-
Change the value of the session-timeout element to the number of minutes you want the console to be idle before it times out the session.
For example:
<session-config> <session-timeout> 30 </session-timeout> </session-config> -
Save and close the file.
Launching the PIX Console
The PIX Console is a web-based application, and can be accessed from either the GlassFish Admin Console or by entering the URL directly into a web browser.
 To Start the PIX Console From the Admin Console
-
Start the GlassFish server, if it is not already running.
-
Start the GlassFish Admin Console.
Tip –You can start the console by right-clicking GlassFish v2.1 on the NetBeans Services window, and then selecting View Admin Console. You can also enter the following URL directly into a browser: http://hostnameadmin-listener-port. The default port number is 4848.
-
In the left navigation panel of the Admin Console, select Web Applications.
A list of available web applications appears.
-
In the pixconsole row, click Launch.
The Login window of the PIX Console appears.
-
Enter the user name and password, and then click Login.
The default user name is pixadmin and the default password is adminadmin.
 To Start the PIX Console From a Web Browser
-
Start the GlassFish server, if it is not already running.
-
Enter the following URL directly into a browser: http://hostnamehttp-listener-port/pixconsole. The default port number is 8080.
For example, http://localhost:8080/pixconsole.
The Login window of the PIX Console appears.
-
Enter the user name and password, and then click Login.
The default user name is pixadmin and the default password is adminadmin.
Viewing Messages
The Messages tab of the PIX Console allows you to view information about the messages that are processed through the PIX/PDQ Manager. You can view the processing flow of the message through PIX/PDQ components, and you can view the content of the input message and any other messages that are generated by the PIX/PDQ Manager components. The PIX Console also lets you view the additional component information, called extensions, to correlate specific component instance with messages. For example, you can view the BPEL process instance ID along with the corresponding message control ID.
 To View Messages
-
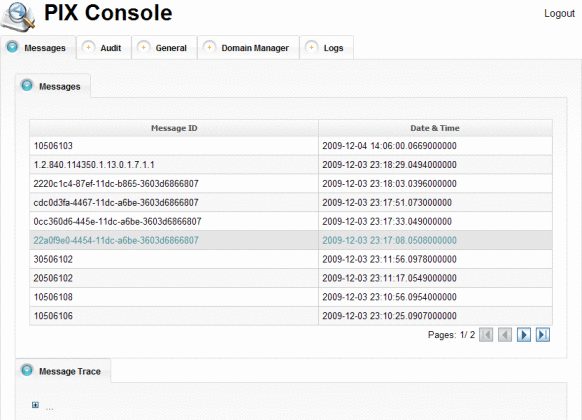
On the PIX Console, click the Messages tab.
A list of transactions appears.
-
To navigate through the transaction list, use the arrow buttons beneath the transaction table.
-
Select a transaction to view from the list.
-
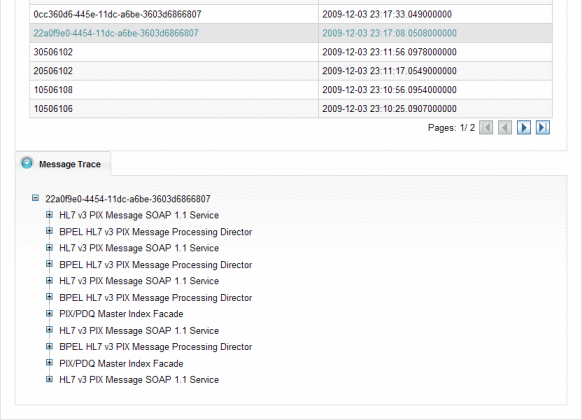
Expand the tree nodes to view how the message was processed through the PIX/PDQ Manager.
-
To view the content of the messages involved in the transaction, do the following:
-
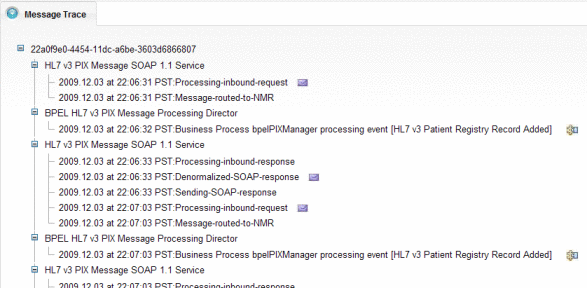
Expand the tree view for the selected transaction until you see the request or response message you want to view.
Note –Each transaction can contain multiple request and response messages since the PIX/PDQ Manager generates additional responses and requests based on the type of transaction being processed.
-
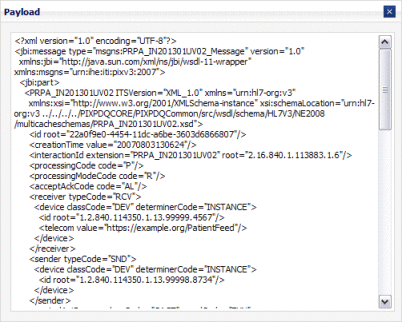
Click the envelope icon to the right of the message description.
The payload appears in XML format.
-
-
To view extensions for the components that processed the transaction, do the following:
Auditing the PIX/PDQ Manager
The PIX/PDQ solution provides complete auditing capabilities for the events that are processed through the system in accordance with the ATNA audit repository framework defined by IHE. You can view information about each event and you can filter the list of events by a variety of criteria, such as the source ID, event ID, date range, and so on.
 To Audit the PIX/PDQ Manager
-
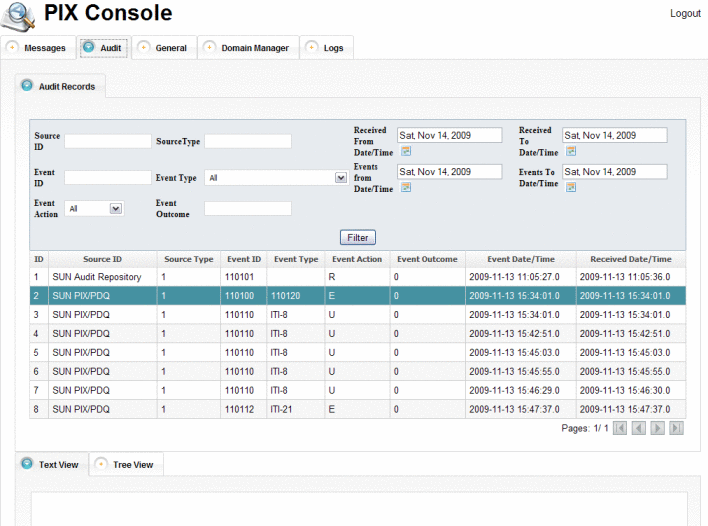
On the PIX Console, click the Audit tab.
The Audit page appears with a list of audit events.
-
To scroll through the pages in the list, use the arrow buttons at the bottom left of the list.
-
To narrow down the list, enter filter criteria in the upper portion of the window, and then click Filter.
For a description of the filter fields, see Audit Filter Fields.
-
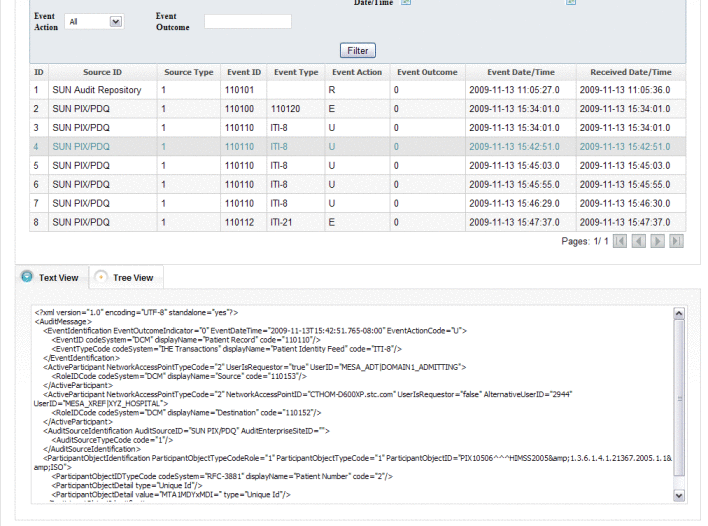
To view detailed information about an audit event, select the entry from the list.
The text appears in XML format in the Text View panel.
-
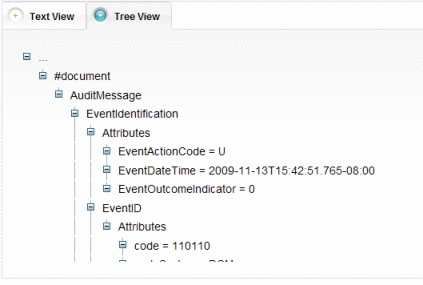
To view the event information in tree view for the selected event, click the Tree View tab near the bottom of the page.
Audit Filter Fields
The following table lists and describes the fields that you can use to narrow down the list of audit entries on the PIX Console.
Maintaining Application Configurations and Variables
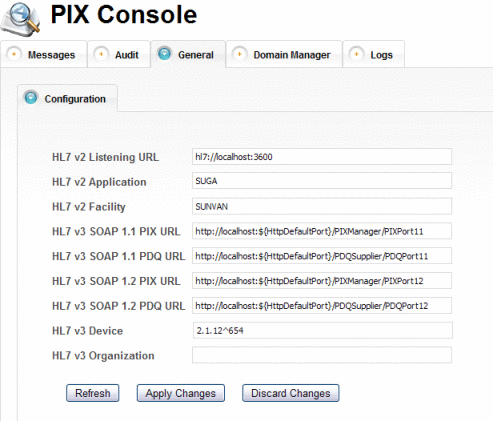
From the PIX Console General page, you can update the values of the predefined application variables and a subset of the application configurations for the PIX/PDQ Manager. The variables define required information for processing both HL7 v2 and HL7 v3 messages.
 To Maintain Application Configurations and
Variables
-
On the PIX Console, click the General tab.
The General page appears with a list of existing PIX/PDQ application variables and certain configurations.
-
To change the value of a variable or configuration, enter the new value and then click Apply Changes.
Tip –If you make a change you need to reverse, click Discard Changes instead of Apply Changes. Any changes that have not been applied are reverted back to their original value.
-
To refresh the list and retrieve any changes to PIX/PDQ application variables and configurations, click Refresh.
Managing Domains
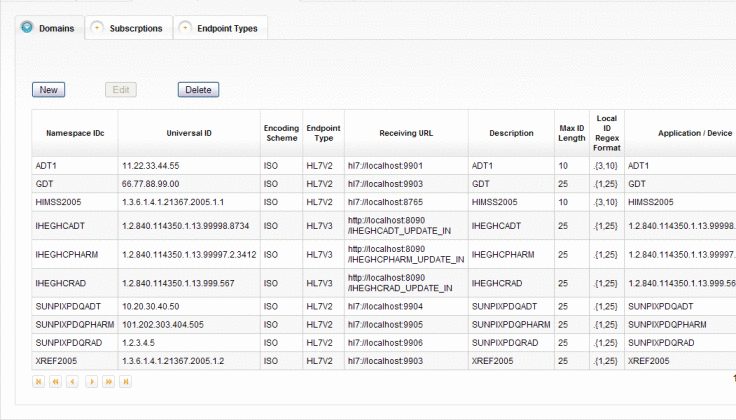
The PIX Console includes a Domain Manager that allows you to view and update information about the external domains that participate in the PIX/PDQ system. You can add new domains and edit or delete existing ones. Changes you make in the Domain Manager are also reflected in the sbyn_systems table of the master index database.
When you update or add domain information, you need to restart the GlassFish server in order for the changes to take effect in the system.
 To Modify Domain Information
-
On the PIX Console, click the Domain Manager tab.
The Domain Manager page appears with a list of the currently defined domains.
-
To add a new domain, do the following:
-
On the Domains tab, click New.
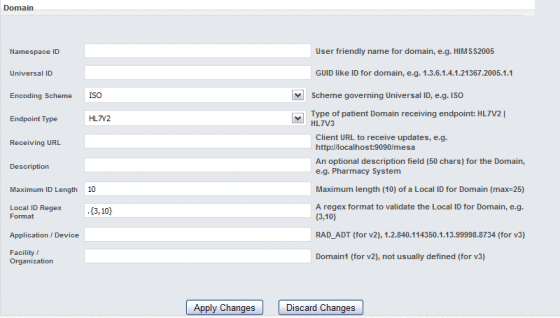
A new page appears with fields you can edit.
-
Enter information about the new domain.
For more information about the fields on this page, see Domain Fields.
-
When you have entered all information, click Apply Changes.
-
On the Confirmation dialog box that appears, click OK.
A new row appears in the domains list.
-
-
To modify domain information, do the following:
-
In the domains list on the Domains tab, select the domain to modify and then click Edit.
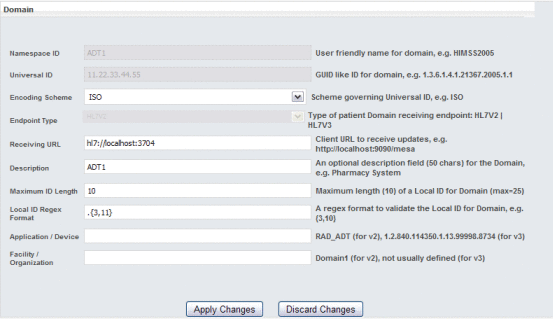
The domain information appears on a new page appears with fields you can edit.
-
Modify the value of any open field.
You cannot modify the namespace ID, Universal ID, or endpoint type. For more information about the fields on this page, see Domain Fields.
-
When you are done with your changes, click Apply Changes.
-
On the confirmation dialog box that appears, click OK.
The domain list reappears with your changes.
-
-
To delete an existing domain, select the domain in the domains list and then click Delete. On the confirmation dialog box that appears, click Delete again.
The row is removed from the domains list.
-
Restart the GlassFish server after making any changes.
Domain Fields
The following tables lists and describes the fields for adding a new domain in the Domain Manager. If you are modifying an existing domain, you cannot update the namespace ID, universal ID, or endpoint type.
Note –
The first three fields in the table correspond to the components of the HL7 assigning authority of the PID-3 field. These fields identify the domain.
|
Field |
Description |
|---|---|
|
Namespace ID |
A user-friendly name for the domain. |
|
Universal ID |
A unique identifier for the domain. The syntax of the ID is governed by the encoding scheme selected below. |
|
Encoding Scheme |
The type of encoding that governs the universal ID, such as ISO. |
|
Endpoint Type |
The type of domain receiving endpoint. The options are HL7v2 and HL7v3. |
|
Receiving URL |
The URL of the HL7 client receiving updates; for example, http://hl7.company.com:7800. |
|
Description |
An optional description of up to 50 characters for the domain. |
|
Maximum ID Length |
The maximum length of the local IDs assigned by the domain. |
|
Local ID Regex Format |
The format of the local IDs assigned by the domain. Use java.util.regex syntax to define the format. |
|
Application/Device |
The name of the HL7 application for HL7 v2. For HL7 v3, this is the name of the device. |
|
Facility/Organization |
The name of the facility for HL7 v2. For HL7 v3, this is the organization (and is generally left empty). |
Maintaining Subscriptions to Patient Updates
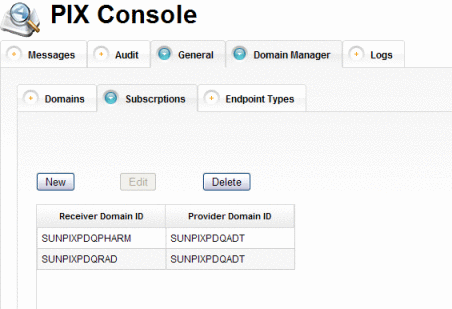
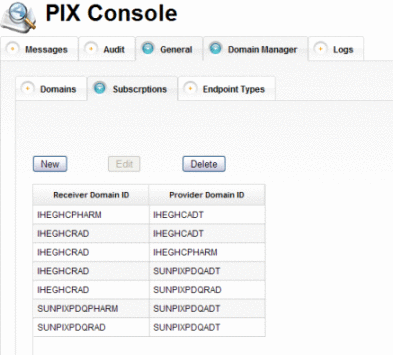
Each domain in the PIX/PDQ system can subscribe to updates made to patient records in the master index database. A subscription definition includes a receiving domain and a provider domain. Any updates to patient records made by the provider domain are published to a JMS topic where they are made available to the receiving domain.
A receiving domain must specifically subscribe to each domain from which it needs to receive update information. In your subscriptions list, one receiving domain might have several subscriptions defined and one provider domain might be specified for several receiving domains.
 To Maintain Subscriptions to Patient Updates
-
On the PIX Console, click the Domain Manager tab, and then click the Subscriptions subtab.
A list appears showing the domains currently sending updates to and receiving updates from each other.
-
To add a new subscription, do the following:
-
On the Subscriptions page, click New.
A new page appears with fields you can edit.

-
In the Receiver Domain ID field, select the domain that will receive updates from the provider domain.
-
In the Provider Domain ID, select the domain whose updates will be received by the subscriber.
-
Click Apply Changes.
The subscriptions list reappears with the new subscription added.
-
-
To change the trigger domain for a subscription, do the following:
-
On the Subscriptions page, select the subscription to modify.
The subscription information appears on a new page appears with fields you can edit.
-
In the Provider Domain ID, select a new domain whose updates will be made available to the subscriber.
-
Click Apply Changes.
The subscriptions list reappears with your changes.
-
-
To delete an existing subscription, select the subscription in the list and then click Delete. On the confirmation dialog box that appears, click Delete again.
The row is removed from the subscriptions list.
Viewing Available Endpoint Types
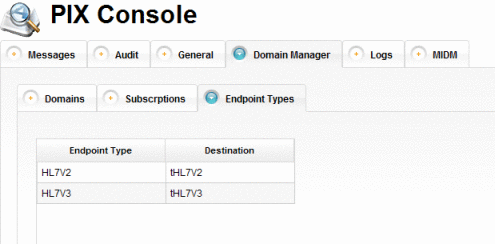
The endpoint types listed on this page are the JMS destinations to which patient record updates are written. A JMS destination is a message repository.
 To View Endpoint Types
-
On the PIX Console, click the Domain Manager tab.
-
Click the Endpoint Types subtab.
A list of available endpoints for the PIX/PDQ Manager appears.
Viewing Server Log Entries for the PIX/PDQ Manager
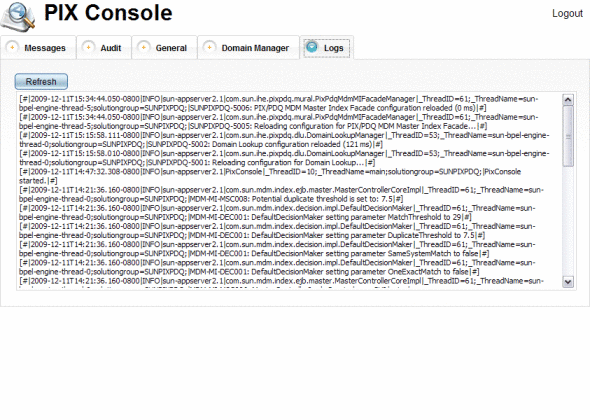
The PIX Console filters server log messages and only displays those entries that pertain to the PIX/PDQ Manager so you do not need to review the entire server log to find information about the PIX/PDQ Manager. You can specify the level of logging detail for each component of the PIX/PDQ Manager. For more information, see Setting Logging Levels for the PIX/PDQ Manager.
 To View the Server Log
- © 2010, Oracle Corporation and/or its affiliates


