| Skip Navigation Links | |
| Exit Print View | |

|
Oracle Java CAPS BPEL Designer and Service Engine User's Guide Java CAPS Documentation |
| Skip Navigation Links | |
| Exit Print View | |

|
Oracle Java CAPS BPEL Designer and Service Engine User's Guide Java CAPS Documentation |
BPEL Designer and Service Engine User's Guide
To View the Installed or Deployed JBI Components
The Composite Application Project
BPEL Designer and Service Engine Features
Supported WS-BPEL 2.0 Constructs
BPEL Service Engine and Oracle SOA Suite
Understanding the BPEL Module Project
Creating Sample Processes in the BPEL Designer
An Asynchronous Sample Process
Travel Reservation Service Sample
Creating a Sample BPEL Module Project
Navigating in the BPEL Designer
Element Documentation and Report Generation
Creating Documentation for an Element
Collapsing and Expanding Process Blocks in the Diagram
To Collapse and Expand a Process Block
Zooming In and Out of the Diagram
Printing BPEL Diagrams and Source Files
To Preview and Print a BPEL Diagram or Source File
Creating a BPEL Module Project
To Check the Status of the GlassFish V2 Application Server in the NetBeans IDE
To Register the GlassFish V2 Application Server with the NetBeans IDE
To Start the GlassFish V2 Application Server in the NetBeans IDE
Creating a new BPEL Module Project
To Create a BPEL Module Project
Creating the XML Schema and the WSDL Document
Creating a BPEL Process Using the BPEL Designer
Creating a Composite Application Project
To Create a New Composite Application Project
Building and Deploying the Composite Application Project
To Build and Deploy the Composite Application Project
Testing the Composite Application
Test the HelloWorldApplication Composite Application Project
Developing a BPEL Process Using the Diagram
Configuring Element Properties in the Design View
Finding Usages of BPEL Components
To Find Usages of a BPEL Component
The BPEL Designer Palette Elements
Adding BPEL Components to the Process
Using the Partner Link Element
Dynamic Partner Links and Dynamic Addressing
Using the CompensateScope Element
CompensateScope Element Properties
Adding an Else If Branch to the If Element
Adding an Else Branch to the If Element
Using the Repeat Until Element
Repeat Until Element Properties
Adding Branches to the Flow Element
Changing the Order of Elements inside Flow
Adding Child Activities to the Sequence
Changing the Order of Elements inside Sequence
To Open the BPEL Mapper Window
To Create a Mapping Without Using any Functions
To Use a Function in a Mapping
To Delete a Link or Function in a Mapping
Using Type Cast and Pseudo-Components
Type Cast and Pseudo Component Limitations
Using Normalized Message Properties
Using Normalized Message Properties in a BPEL Process
Using Predefined Normalized Message Properties in a BPEL Process
To Use Predefined Normalized Message Properties in a BPEL Process
Adding Additional Normalized Message Properties to a BPEL Process
To Add a Normalized Message Property Shortcut to a BPEL Process
To Edit an NM Property Shortcut
To Delete an NM Property Shortcut
To Add a Normalized Message Property to a BPEL Process
BPEL Code Generation Using NM Properties
General Normalized Message Properties
Binding Component Specific Normalized Message Properties
To Add a Compensation Handler to Scope or Invoke Elements
To Add a Termination Handler to Scope or Process Elements
Understanding Correlation. Using the Correlation Wizard
Elements That Use and Express Correlation
Defining Correlation Using the Correlation Wizard
BPEL Process Logging and Alerting
To Set the Log Level for the BPEL Service Engine
Configuring the BPEL Service Engine Runtime Properties
Accessing the BPEL Service Engine Runtime Properties
BPEL Service Engine Deployment Artifacts
Testing and Debugging BPEL Processes
To Add a Test Case and Bind it to a BPEL Operation
Steps in Debugging BPEL Processes
Starting and Finishing a BPEL Debugging Session
Using Breakpoints to Debug BPEL Processes
Group operations over breakpoints
Monitoring Execution of BPEL Processes
Monitoring the BPEL Service Engine
Installing the BPEL Monitor API and Command Line Monitoring Tool
To Install the Monitoring Tool
Using the BPEL Monitor Command Line Tool
To Use the BPEL Monitor Command Line Tool
Configuring Quality of Service (QOS) Properties, Throttling, and Redelivery
Configuring the Quality of Service Properties
To Access the Config QOS Properties Editor
Configuring Message Throttling
Configuring an Endpoint for Throttling
Using Dynamic Partner Links and Dynamic Addressing
Using a Literal to Construct an Endpoint
Using an Existing Partner Link's Endpoint
Using an Incoming Message to Extract the Endpoint
Using a Database Query to Provide an Endpoint
Sending Service Endpoint References
Configuring Persistence for the BPEL Service Engine
Setting the JVM Classpath to the Database JDBC Drivers
To Set the GlassFish JVM Classpath Settings
Configuring the User and Database for Persistence
Creating an XA Connection Pool and a JDBC Resource
To Create an XA Connection Pool
Creating a Non-XA Connection Pool and JDBC Resource
Enabling Persistence for the BPEL Service Engine
To Enable Persistence for the BPEL Service Engine
Truncating and Dropping Tables
Configuring Failover for the BPEL Service Engine
Using BPEL Schemas Different from the BPEL 2.0 Specification
Relationship of Service Endpoint to Test Cases
GlassFish V2 Application Server HTTP Port
Travel Reservation Service Endpoint Conflict
Disabling Firewalls when Using Servers
Required Correlation Set Usage is Not Detected by the Validation System
The following topics describe how to test and debug BPEL processes:
Testing a deployed business process application involves using test cases that act as remote partner services. These test cases send SOAP messages to the BPEL Service Engine.
In simple words, the interaction process is as follows:
The BPEL Service Engine receives the SOAP message, creates an instance of the BPEL process, and starts executing the instance. A BPEL process can have many running instances.
The BPEL Service Engine receives a message and, using correlation, routes it to the appropriate instance of the process. If an instance does not yet exist, a new instance is created.
To test-run a deployed business process application, you need to configure test cases to act as remote partner services sending SOAP messages to the BPEL Service Engine.
In order to obtain test results you must do the following in the order given:
All steps in this section assume the following:
You have already created a new BPEL Module Project containing a WSDL file that defines an operation you want to test.
You have successfully completed a build of the BPEL Module Project.
You have added your BPEL Module project to a Composite Application project as a JBI Module.
The New Test Case wizard appears.
In the Projects tree, a new folder is created under the Test node, containing two files: Input.xml and Output.xml.
Note - If you view the test case in the Files window, you see Concurrent.properties as a third file.
Description — string
Destination — URL (from the .wsdl file's <soap:address location="THIS"> tag)
Identifies the location of the web service to be tested.
SoapAction — (default: blank)
Input File — (read-only; generated by system)
Name of the input file. This file contains the input data for the test case.
Output File — (read-only; generated by system)
Name of the output file. This file contains the output data for the test case.
Concurrent Threads — integer; default = 1
Each thread can invoke the test case multiple times (see the following property). Thus, if conc=2 and inv=3, the test case will be run 6 times (two threads, each run thrice).
Invokes Per Thread — integer; default = 1
Number of times each thread invokes the test case.
Test Timeout (sec) — integer; default = 30
How long each thread has to finish. If it does not finish in the allotted time, then an exception is thrown.
Calculate Throughput — boolean
Comparison Type — drop-down list with the following options:
identical — Considers the output and actual output as a stream of characters.
binary — Considers the output and actual output as a stream of bytes.
equals — Considers the output and actual output as a XML documents.
Feature Status — drop-down list with the following options:
progress — Marks test completion as "success", regardless of actual outcome.
done — Records actual outcome of test.
If it is empty, this is a special state that triggers a special operation when the test is run.
Each time the test is run, the current output is compared to the contents of Output.xml. If any differences are detected, they will be stored in the Actual_yymmddhhmmss .xml file under the test case folder. However, in the special case where Output.xml starts null, then the output is written to Output.xml.
In each run after the first, assuming Output.xml is no longer null, its contents are preserved. In other words, a previous output is never overwritten by new results.
To run a single test case, right-click the node for your specific test case, and choose Run. Check the Output window for the results.
To run all test cases in a project, right-click your Composite Application project and then select Test (Alt+F6). Check the Output window for the results.
The first time you run your test, the results correctly report that it has failed. This happens because the output produced does not match the (empty) Output.xml file, and the file's null content is replaced with the output of the first run. If you run the test again without changing the input, the second and subsequent runs report success, since the output matches the contents of Output.xml.
Test results are displayed in the Output window. Detailed results are also displayed in the JUnit Test Results window, which opens automatically when you run a test case. If you change the value in the Input.xml and rerun the test:
If the feature-status property is set to progress, then the test indicates success even though a mismatch occurred.
If the feature-status property is set to done, then the test indicates failure.
If you right-click the test case node and click Diff, the window displays the difference between the latest output and the contents of Output.xml.
Debugging a BPEL process follows the same general principles as debugging a Java application. Debugging a BPEL process involves setting breakpoints in the source code and executing the process step-by-step within a debugging session. The BPEL Debugger provides a visual representation of the BPEL process execution. This enables you to view and change variables, monitor the results of executing expressions, and use fault breakpoints to monitor the state of variables before a fault is thrown.
The main steps in debugging BPEL processes are:
Confirm that the GlassFish application server has started.
Create test cases.
For sample processes, test cases are automatically created; for new projects, you need to create at least one test case.
Open the BPEL process file either in the Source view or Design view.
Set breakpoints in the code or on the diagram. Optionally, add watches for XPath expressions in your process or add fault breakpoints.
Start a debugging session. Watch the BPEL Debugger Console window for confirmation that the debugging session has started.
Within the debugging session, run one or several test cases.
View execution of BPEL processes on the diagram in the Design view or in the BPEL Process Execution window and view running instances of BPEL processes in the BPEL Process Instances window.
When an instance stops at a breakpoint, step through the code or the diagram, examine the values of variables in the BPEL Variables window, or observe the values of XPath expressions in the Watches window.
Finish the debugging session.
A debugging session begins when you connect the BPEL Debugger to the BPEL Service Engine. Only one debugging session can be running with the BPEL Service Engine at a given time.
After a BPEL debugging session starts, you can execute process instances step-by-step, inspecting the values of BPEL variables and XPath expressions in the Local Variables and Watches windows. You can monitor the execution of a BPEL process within a debugger session on the diagram in the Design view: the activities that are being executed are highlighted on the diagram as the current execution position advances. The BPEL Process Execution window also shows the execution of the BPEL process.
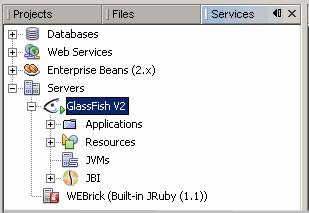
If the server is not started, right-click it and then select Start.
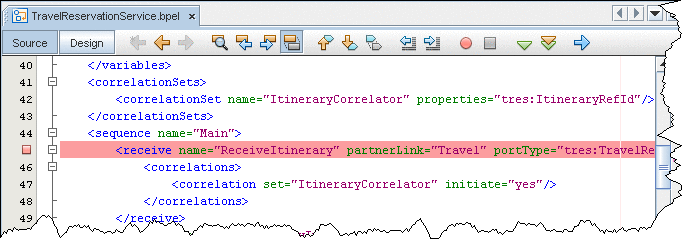
To set breakpoints in the Source view, click next to the line where you want to set the breakpoint.
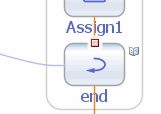
To set breakpoints on the diagram, switch to the Design view, right-click the element and then select Toggle Breakpoint. A red square appears at the top of the element with a breakpoint.
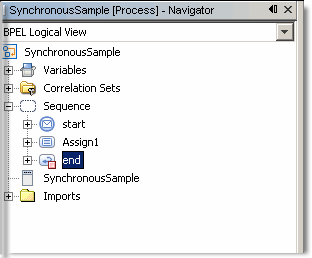
The Toggle Breakpoint menu command is also available for the elements in the Navigator BPEL Logical View. For the elements with breakpoints, the Navigator shows a small red box (ReceiveItinerary).

Note - You can also add XPath expressions that are not present in the code, but that would be valuable from the debugging point of view.
A debug session is established on the BPEL Service Engine.
11:35:17 Connecting to localhost:3343
Enables debugging with the BPEL Service Engine (sets the DebugEnabled property of the BPEL Service Engine to true)
Builds the Composite Application project and all JBI Modules added to this project
Deploys the Composite Application project to the BPEL Service Engine
Starts the debugging session by connecting the BPEL Debugger to the BPEL Service Engine
Therefore, whenever you start a debugging session you can be sure that the latest version of the BPEL process is deployed on the BPEL Service Engine.
Now you can run a test case and monitor the execution of the BPEL process until it stops or reaches a breakpoint. As the process advances, the current context is displayed on the diagram and in the BPEL Process Execution window.
If you have several debugging sessions (you may have a Java debugging session running at the same time) and want to change the current session, double-click the name of this session in the Sessions window. Alternatively, right-click the session you want to make current and select Make Current. This session becomes current and the BPEL Process Instances, Watches and Local Variables Windows are updated to show the data related to the new current session.
When you want to finish a debugging session, open the context menu for the session you want to stop and choose Finish in the Sessions window or select Finish Debugger Session on the toolbar. A message that the debugging session is finished is displayed in the BPEL Debugger Console.
To finish all debugging sessions, in the Sessions window, right-click any session and choose Finish All.
11:35:17 Connecting to localhost:3343
11:36:19 Debug session started
The Debug (BPEL) command performs the following actions:
Enables debugging with the BPEL Service Engine (sets the DebugEnabled property of the BPEL Service Engine to true)
Builds the Composite Application project and all JBI Modules added to this project
Deploys the Composite Application project to the BPEL Service Engine
Starts the debugging session by connecting the BPEL Debugger to the BPEL Service Engine Therefore, whenever you start a debugging session you can be sure that the latest version of the BPEL process is deployed on the BPEL Service Engine
As the process advances, the current context is displayed on the diagram and in the BPEL Process Execution window.
If you have several debugging sessions (you may have a Java debugging session running at the same time) and want to change the current session, double-click the name of this session in the Sessions window. Alternatively, right-click the session you want to make current and select Make Current. This session becomes current and the BPEL Process Instances, Watches and Local Variables Windows are updated to show the data related to the new current session.
A message that the debugging session is finished is displayed in the BPEL Debugger Console.
Breakpoints are used to instruct the BPEL Debugger to stop execution at the specified place of a BPEL process. When a BPEL process instance reaches a breakpoint, it becomes suspended and you can step into the code, change the current process instance in the BPEL Process Instances window, track the execution of the process instance in the BPEL Process Execution window and in the Design view, examine the values of variables in the Local Variables window, view the process partner links in the Partner Links window and view the values of XPath expressions in the Watches window.
You can also use fault breakpoints to check the values of variables before a fault is thrown.
To view and organize the breakpoints currently set in the IDE, open the Breakpoints window by choosing Windows -> Debugging -> Breakpoints (Alt-Shift-5). For each breakpoint, you can see the name of the file and the line where this breakpoint is located. In the Breakpoints window you can enable and disable breakpoints by checking or removing the checkbox in the Enabled column.
In the Source view, click the left margin of the row where you want to place a breakpoint.
In the Design view, right-click an element where you want to place a breakpoint and choose Toggle Breakpoint (Ctrl-F8).
In the Design view, breakpoints are displayed as small red squares on top of specific elements. In the Source view, breakpoints are shown as red squares on the left margins of code lines.
Alternatively, you can set and remove breakpoints in the BPEL Logical view of the Navigator window by choosing Toggle Breakpoint. In the Navigator window breakpoints are shown as small red squares attached to elements.
Once the project has reached the breakpoint it is suspended. You can manage the subsequent execution using the commands available in the Run menu or as buttons on the toolbar.
The following commands are available from within the debugging session:
Pause. Once the user activates this action, the process will continue till it reaches the first element on which it can stop. If there is no current process instance, the debugger will wait for the first execution event from any process instance.
Continue (F5). Once the process has reached the breakpoint or is paused you can choose Continue. This action causes the current process instance to run until it encounters the next breakpoint or until the instance completes. The state of the instance changes to Running.
Step Into (F7). Steps to the next BPEL activity. As you step, the current line indicator advances, the current position is highlighted on the diagram, and the contents of the BPEL Debugger windows change accordingly. If the current activity has any enclosed elements, the process will step to the first enclosed element. Sometimes it is not visible on the diagram but is reflected in the BPEL Process Execution window. For example, if an Assign activity has <copy> element inside it, from the Assign the process will step to Copy.
Step Over (F8). Steps to the next BPEL activity of the same level as the current activity. If the current activity has any enclosed elements, they all are executed without suspension.
Step Out (Ctrl-F7). Steps to the next higher level activity of the process. For example, an Assign activity has several Copy elements inside. If one of the Copy elements is the current activity, performing Step Out will move you to the next activity of the Assign level and you will not have to step through all the Copy elements.
Run to Cursor (F4). Runs the BPEL process to the position selected in the Navigator window (BPEL Logical View), on the diagram (in the Design view) or to the cursor location in the Source view. When the location of the cursor is reached, the process instance becomes suspended.
To disable a breakpoint do one of the following:
On the diagram, click on the small red square indicating the breakpoint. This disables the breakpoint but does not remove it completely.
In the Breakpoints window, clear the Enabled checkbox for the breakpoint you want to disable.
The toolbar contains three buttons for group operations over the process breakpoints.
Enable Breakpoints for Selected Element. Enables all the breakpoints for the selected element and it's enclosed elements.
Disable Breakpoints for Selected Element. Disables all the breakpoints for the selected element and it's enclosed elements.
Delete Breakpoints for Selected Element. Deletes all the breakpoints for the selected element and it's enclosed elements. If no element is selected on the diagram, the Process element is considered selected for the operations.
When a running process reaches a breakpoint, the Design view highlights the current position of the debugger and uses colors to differentiate between the states of BPEL activities. As the process advances, the colors and icons for the activities on the diagram are updated to reflect the execution progress.
On the diagram, the following notation is used:
Green color (glowing). The breakpoint set for the activity is reached.
Gray color (grayed-out effect). The activity has not been executed yet.
Green triangle. The activity is now being executed.
Blue triangle. The activity has been successfully completed.
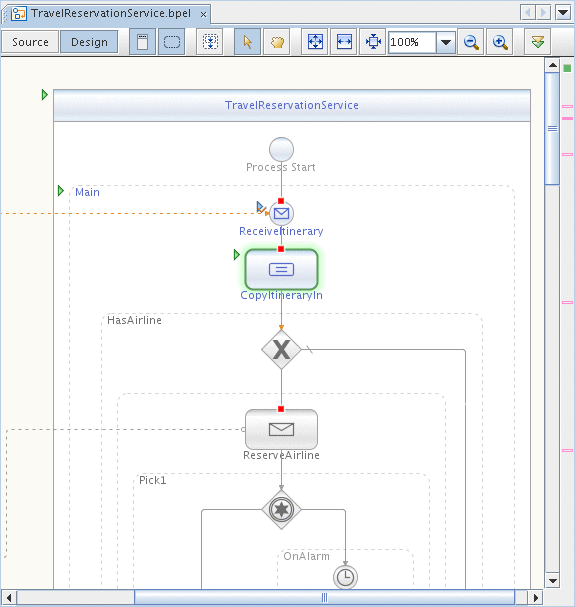
You can also monitor the execution of current BPEL process instances in the BPEL Process Execution window (see below).
When a debugging session starts, debugger windows are displayed below the editing area. The Sessions, BPEL Process Instances, BPEL Variables, and BPEL Process Execution windows contain information related to BPEL processes running within the current debugging section.
If a debugger window is not displayed, choose Window > Debugging > window-name (for example, Window > Debugging > BPEL Process Instances).
The Breakpoints and Watches are standard IDE debugger windows. They display all breakpoints and watches set in the IDE.
The Sessions window lists all open debugging sessions, including Java and BPEL debugging sessions. For the BPEL Service Engine, only one session can be started. However, the Sessions window also displays other open debugging sessions, such as Java sessions. Only one of the open debugging sessions can be current, and it is shown in bold. Other debugger windows, such as BPEL Process Instances, BPEL Process Execution, and BPEL Variables, display data related only to the current debugging session.
The information provided for each session includes:
Name. The name of the session.
State. The current state of the session. Sessions can be starting or running.
Language. The language of the application debugged in this session.
You can perform the following actions on sessions available in the context menu:
Make current. Makes the selected session current.
Finish. Finishes the selected session.
Finish all. Finishes all debugging sessions.

The BPEL Process Instances window lists all BPEL process instances deployed to the BPEL Service Engine and their currently running instances. For each process instance correlation sets and Faults are listed as sub-nodes.
If the current session is not a BPEL Debugger session, this window is empty. The BPEL Process Instances window is populated when a debugging session starts on the BPEL Service Engine, or when the current session is a BPEL Debugger session.
The information displayed for each process instance includes the instance name, unique instance ID, and its state.
Process instances can exist in one of the following states:
Running. The instance is currently being executed on the BPEL Service Engine.
Suspended. The instance has been suspended for some reason. For example, the process instance has reached a breakpoint.
Unknown. The status of the instance is unknown.
A process instance that is current is shown in bold. A process instance becomes current when it reaches a breakpoint or when you manually make it current.
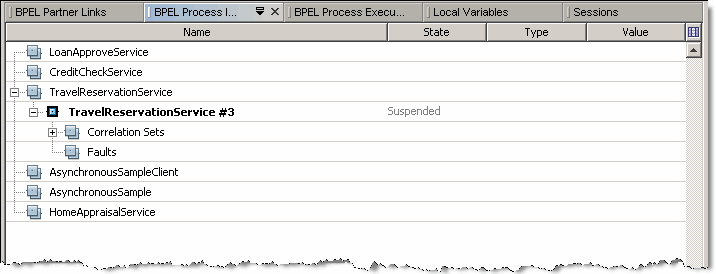
To make a process instance current, do one of the following:
Double-click the process instance.
Right-click the process instance and choose Make Current from the context menu.
To terminate a process instance:
Right-click the process instance and select Terminate from the context menu. The process instance is terminated and removed from the list.
For the Correlation Sets node the information comes out during the process execution.
For each process instance correlation set, a list of properties it includes is shown. For the properties, type and value information is displayed. Find more information on Correlation sets, properties, and property aliases here: Using Correlation.
The Local Variables window shows the structure of local variables and their values for the current process instance and current position. The current position is the place where the current process instance became suspended. When you change the current process instance, the records in the Local Variables window are updated to reflect the variables for the new current process instance and the new current position.
The structure of local variables is shown as a tree. The information provided for each variable includes the variable name and value.
In the Local Variables window you can do the following:
View the variable structure. To do this, expand the variable node in the tree.
View and edit the values of variables. To edit the value of a variable, click the ellipsis (...) button and enter the new value in the editor window.
The structure of local variables is shown as a tree. The information provided for each variable includes the variable name and value.
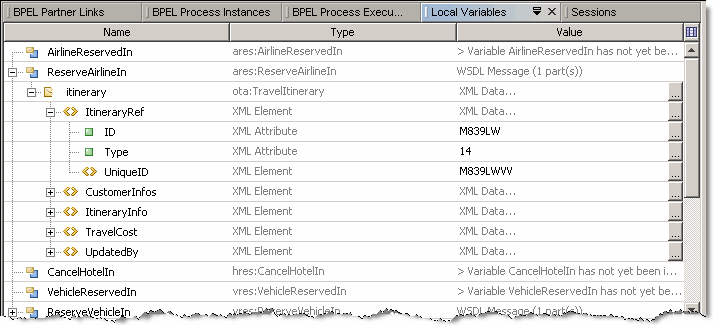
The Watches window shows the list of XPath expressions that you want to monitor. You add watches explicitly before or during the debugging session. The Watches window shows the expression and its value. The value of the expression may change as the process advances depending on the logic of your process.

In the Source view, copy the XPath expression you want to watch. The XPath expressions can be found inside the <condition> tag.
In the Design view, select an element that has an expression and copy the expression from the Condition row in the Properties window.
Paste the XPath expression you have copied.
Enter any valid expression that is compliant with XPath 1.1.
The BPEL Process Execution window graphically represents the progress of executing the current BPEL process instance in the BPEL Debugger. When you change the current process instance, the process tree in the BPEL Process Execution window is updated to reflect the state of the new current process instance and the new current position.
In the BPEL Process Execution window, the following colors are used to display the state of BPEL activities:
Green — The activity is being executed at the moment.
Gray — The activity has not been executed yet.
Black — The activity has been executed.
BPEL Process Execution Window displays the following information:
Name — The name of the activity.
Thread — The thread in which the activity is/was executed. For the nodes that have not yet been executed no thread information is provided.
Line — Contains the path to the file and the line number for the activity in the file.
XPath — Shows XPath expression pointing to the activity.
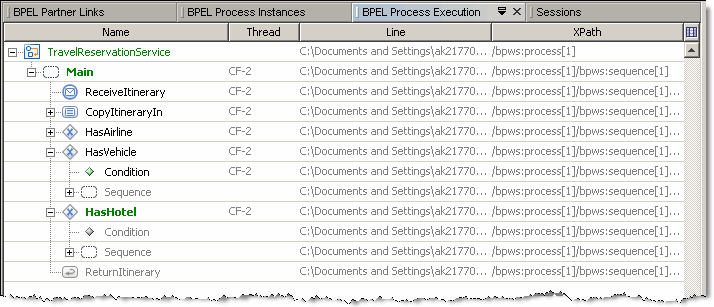
Note - In the BPEL Process Execution window, you can only view the progress of executing BPEL processes. You cannot perform any actions in this window.
The Partner Links window lists the all the partner links defined in the BPEL Process.
The information provided for the partner links includes:
My Role
Partner Role: Used for two-way operations only
Endpoint: Endpoint information available for dynamically defined partner links only. For more information see Dynamic Partner Links and Dynamic Addressing

You can see the following messages in the BPEL Debugger Console:
The Debugger is attempting to connect to the BPEL service engine.
The Debugger has successfully connected to the BPEL service engine and the debug session has started.
If you see this message, verify the following:
The GlassFish V2 Application Server is running.
The BPEL service engine is started.
The DebugEnabled property of the BPEL service engine is set to true.
The host name is the host name of the machine that runs the GlassFish V2 Application Server you are connecting to ( localhost by default).
The port value is the same as the DebugPort property of the BPEL service engine you are connecting to (3343 by default).
You already have a running debug session attached to this particular service engine.
The Debugger lost connection to the server. Check that the server is running and the network is up.
You explicitly terminated the debug session when it was connecting.
You explicitly terminated the debug session when it was running.