7 How Does My Current Forecast Compare with My Pipeline?
This tutorial shows you how to compare your current forecast with your pipeline.
Forecasting future sales is a method of providing predictions of future revenue for specific time periods. Typically, sales managers create a sales forecast for a sales territory and for a specific time period. The forecast includes revenue from all opportunities that meet the set criteria.
Sales representatives can see the current forecasts for their territories (as well as past and future forecasts) from the Manage Sales Forecasts page. The forecasting data on that page includes the following terms:
-
Closed revenue - the actual revenue for the target territory that was closed during the forecast period
-
Pipeline - the total revenue that is scheduled to close within the forecast period
-
Quota - the revenue target associated with the expected performance of a sales representative's territory for a given forecast period
How to Compare Your Current Forecast with Your Pipeline
-
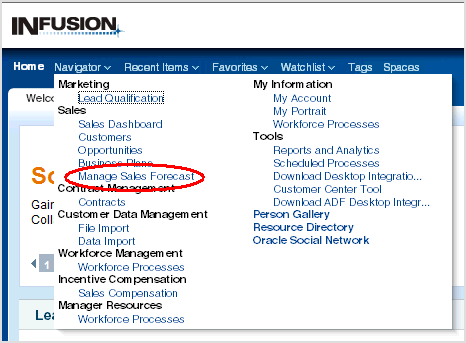
From the Navigator menu, select Manage Sales Forecast.
-
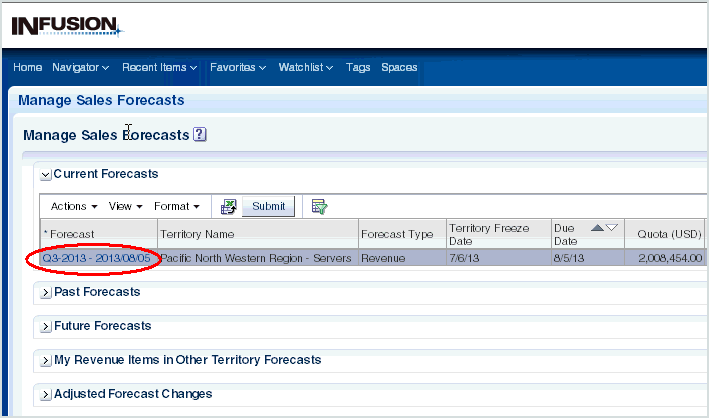
In the Current Forecasts pane of the Manage Sales Forecasts page, click a revenue forecast - that is, a forecast whose Forecast Type is Revenue - for the territory that you want to examine.
-
A Revenue Forecast: <Period> page is displayed, available either for viewing or editing. If you are in the time period for updating forecast information, you can edit the forecast; otherwise you can only view the forecast data.
The lower part of the page contains one or more forecast-related tabs. The Forecast Items tab is always displayed. The Forecast Summary and Forecast Analysis tabs are available if a sales administrator has enabled them.
The following figure shows an Edit Revenue Forecast page, with the Forecast Items tab visible, and the Forecast Summary and Forecast Analysis tabs enabled.
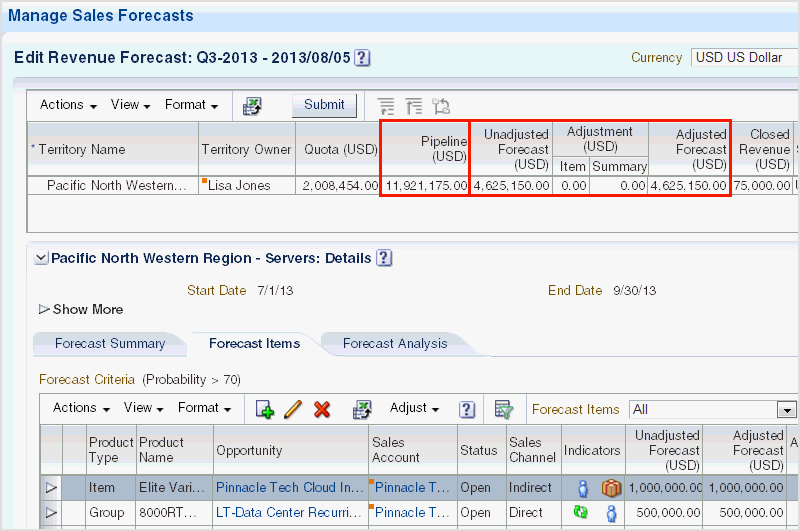
In this page, you can view both your adjusted and unadjusted forecasts for the territory, and compare these forecasts with your pipeline.
-
If the Forecast Summary tab is enabled, click that tab to see more details about the current and previous forecast and the current pipeline.
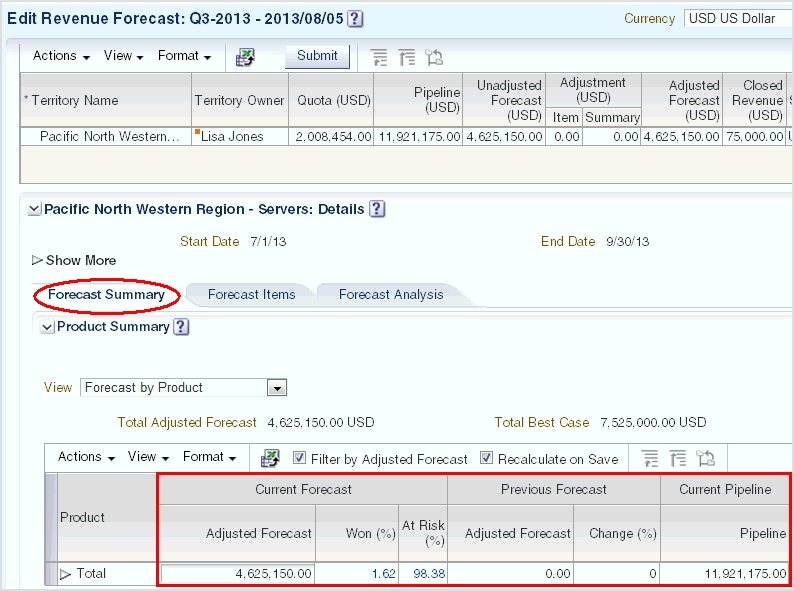
The Forecast Summary tab allows users to enter adjustments at an aggregate level by product and time. Specifically, instead of adjusting forecasts from an individual line item level, managers can view the aggregate product forecast and make summary adjustments at that aggregate level.
-
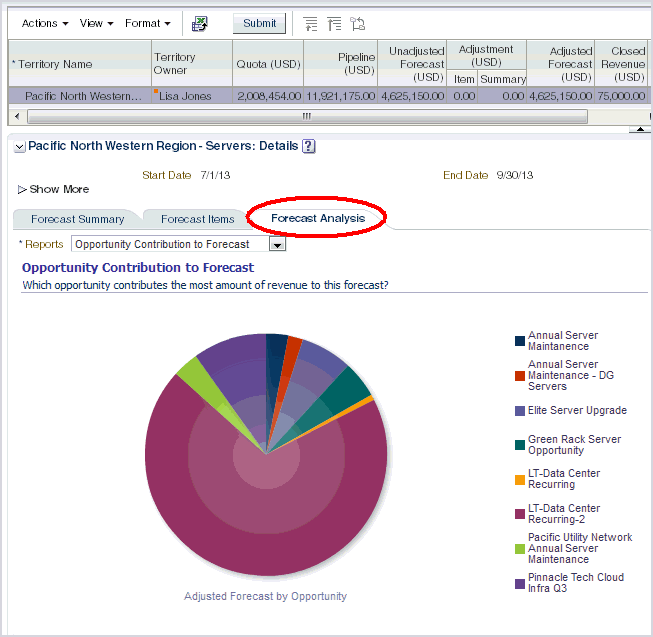
If the Forecast Analysis tab is enabled, then click that tab to see one or more forecast-related, context-sensitive analytic reports.
-
Select additional analytic reports to view from the Reports menu.

-
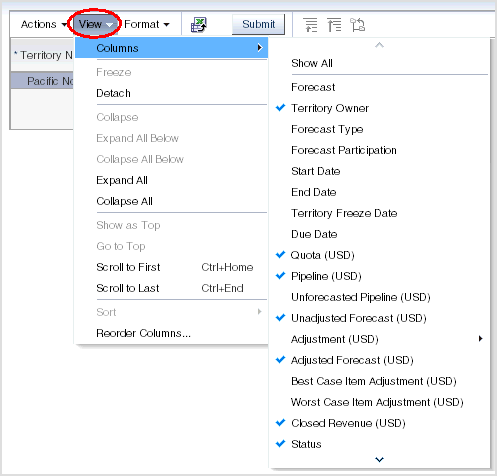
In the Revenue Forecast page, you can also see additional forecast and pipeline details, by selecting more columns.
To select other columns, click View, then Columns, then select from the displayed column list.
-
View and analyze past and future forecasts by expanding the appropriate Past Forecasts and Future Forecasts panes in the Manage Sales Forecast page. The columns and options on these panes are similar to those in the Current Forecasts pane.


