1 How Do I Find the Top Ten Accounts by Revenue?
This tutorial shows you how to find the top ten accounts by revenue.
This tutorial shows you how to how to find the ten opportunities that can bring in the most revenue if they close. This potential revenue is referred to as Open Opportunity Revenue in the tutorial. You can also use Closed Opportunity Revenue, which is revenue from closed opportunities for a customer, or Expected Opportunity Revenue, which is the revenue amount multiplied by the win probability from opportunities for a customer.
How to Find the Top Ten Accounts by Revenue
-
From the Navigator menu, select Reports and Analytics.
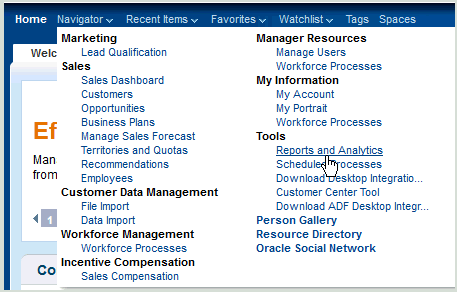
The Reports and Analytics page is displayed.
-
Click Create and select Analytics.
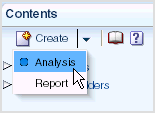
The Select Subject Area list is displayed.
-
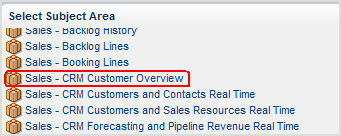
Select the Sales - CRM Customer Overview subject area.
-
Expand the subject area folder (by clicking the arrow next to the folder) and select these columns to include in the analysis:
-
From the Customer folder: Customer Name
-
From the Customer folder: Party Type Code
-
From the Pipeline Facts folder: # of Opportunities
-
From the Pipeline Facts folder: Open Opportunity Revenue
For each column that you want to add:
-
Select the column in the Subject Areas list.
-
Click the Add button (the right arrow button to the right of the Subject Areas list) to move it to the Selected Columns list.

-
-
Click Next.
-
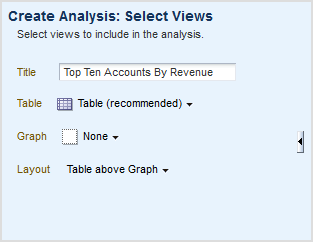
Specify the views to include in the analysis as follows:
Click the Table box and select Table (recommended).
-
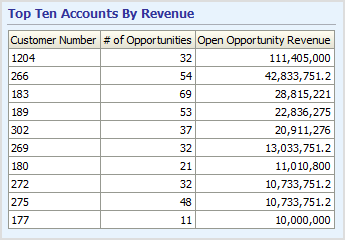
In the Title field, enter Top Ten Accounts By Revenue.
-
Click Next.
-
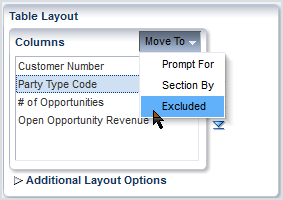
To further define the table to include only related account information, exclude Party Type Code (by selecting it, clicking Move To, and selecting the Excluded option on the Move To menu):
-
Click Next.
-
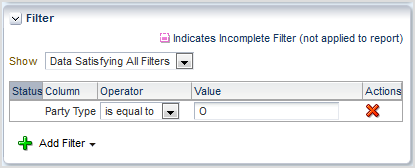
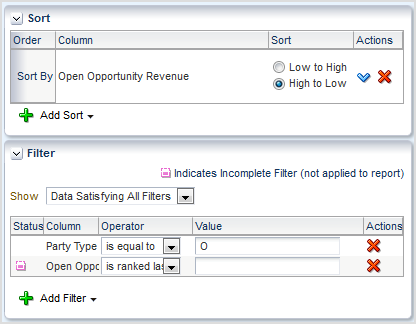
Add a filter to show only the "organization" party type by performing the following steps:
-
Click Add Filter and select Party Type Code.
-
In the Operator column, select is equal to.
-
In the Value column, enter O.
-
-
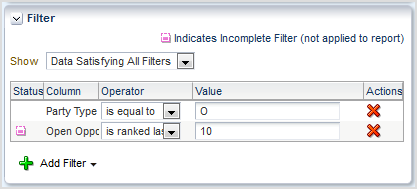
Add a filter to show only the ten accounts with the highest amount of revenue by performing the following steps:
-
Click Add Filter and select Open Opportunity Revenue.
-
In the Operator column, select is ranked last.
-
In the Value column, enter 10.
-
-
Sort Open Opportunity Revenue from high to low by performing the following steps:
-
Click Add Sort and select Open Opportunity Revenue.
-
Select High to Low.
-
-
Click Next.
-
Leave the default settings on this page and click Next.
-
Save the analysis as follows:
-
In the Analysis Name field, specify a name for the analysis.
-
In the Save In list, select the folder where you want to save the analysis.
The folder in which you save the analysis controls whether the analysis is available only for your personal use or available to other users.
If you save the analysis in My Folders, then it available only for your personal use. If you save the analysis in Shared Folders/Custom, then it is available to all users who can access Shared Folders/Custom.
-
Click Submit, then OK in the confirmation dialog.
-
The final report is saved in the specified folder. You can now navigate to the analysis, which looks like this:
