13 Which Were the High Value Opportunities that We Most Recently Lost to Our Competitors?
This tutorial shows you how to create an analysis to determine which were the high value opportunities that were most recently lost to competitors.
How to Identify the High Value Opportunities Recently Lost to Competitors
-
From the Navigator menu, select Reports and Analytics.
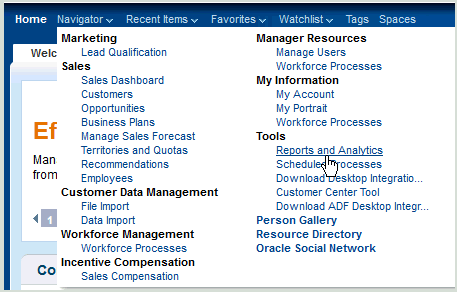
The Reports and Analytics page is displayed.
-
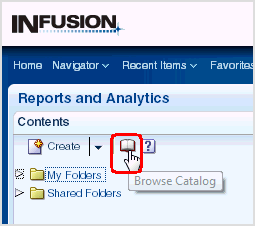
In the Contents pane, click the Browse Catalog icon.
-
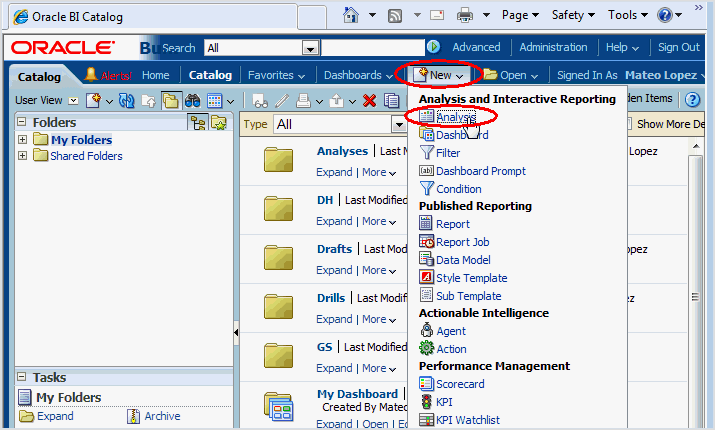
In the Oracle BI Catalog window, click New, then Analysis.
-
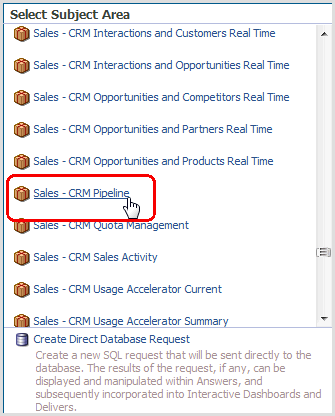
Select the Sales - CRM Pipeline subject area.
-
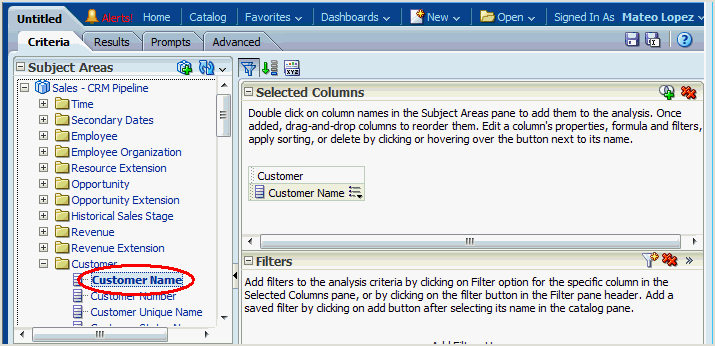
In the Subject Areas list, expand Customer, then double-click Customer Name. This automatically adds Customer Name to the Selected Columns list.
-
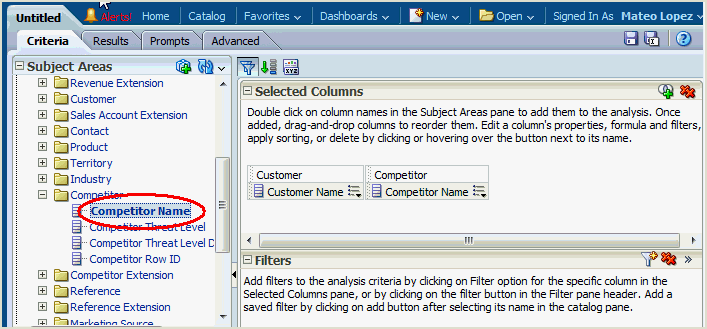
In the Subject Areas list, select Competitor, then double-click Competitor Name.
-
Restrict the analysis to exclude blank competitor names, that is, for opportunities where there were no competitors, by performing the following steps:
-
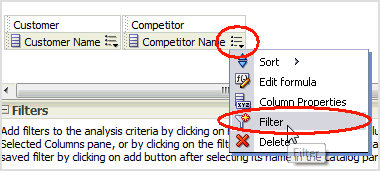
Click the icon beside Competitor Name, and select Filter.
-
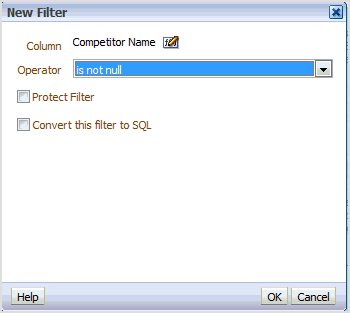
Select is not null for the Operator.
-
Click OK.
-
-
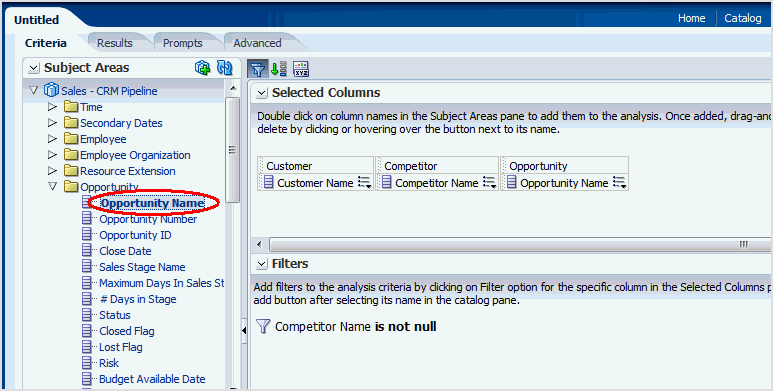
In the Subject Areas list, expand Opportunity, then double-click Opportunity Name.
-
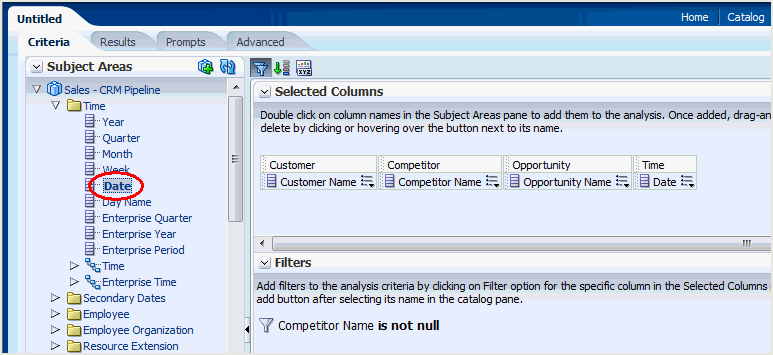
In the Subject Areas list, expand Time, then double-click Date.
-
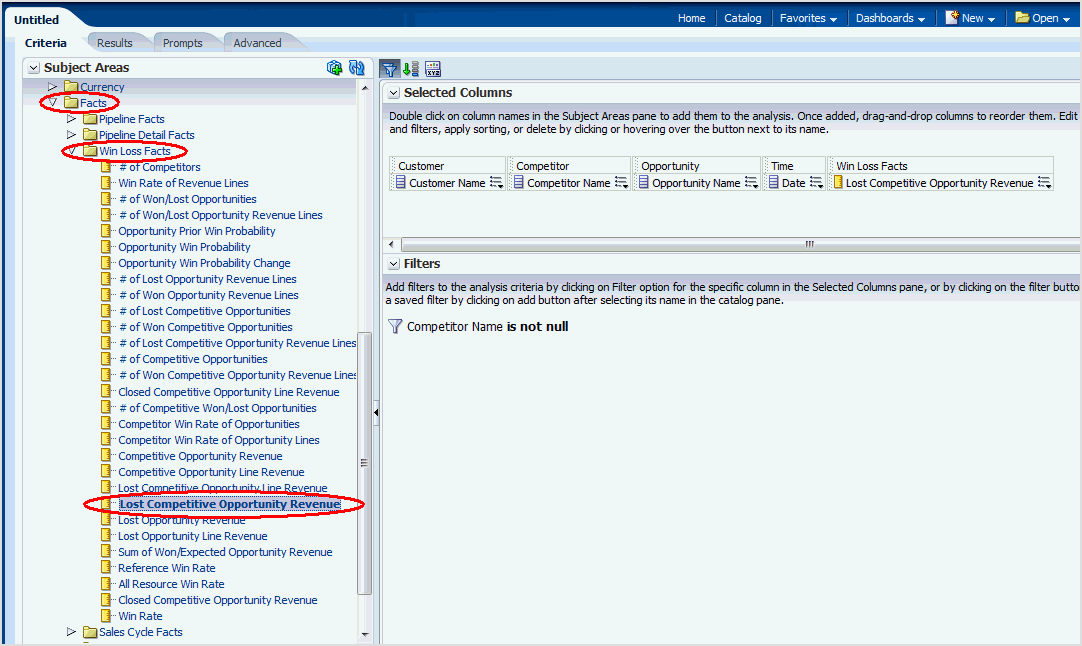
In the Subject Areas list, expand Facts, then Win Loss Facts, and double-click Lost Competitive Opportunity Revenue.
-
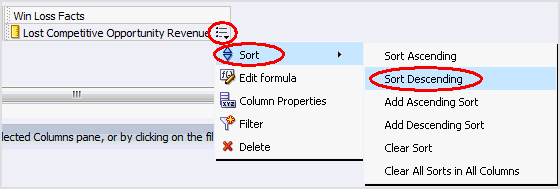
To enable the highest value revenues to be displayed first, click the icon beside Lost Competitive Opportunity Revenue, select Sort, then Sort Descending.
-
Restrict the analysis to the top 10 highest value revenues, by performing the following steps:
-
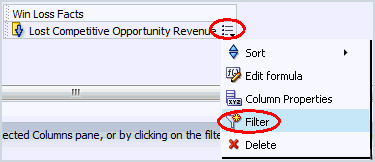
Click the icon beside Lost Competitive Opportunity Revenue, and select Filter.
-
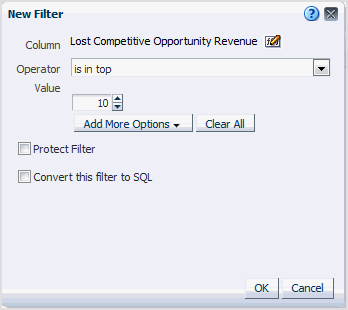
Select is in top for the Operator, and leave 10 as the default Value.
-
Click OK.
-
-
To shorten the column heading for Lost Competitive Opportunity Revenue - to Lost Revenue, for example - perform the following steps:
-
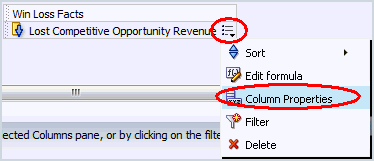
Click the icon beside Lost Competitive Opportunity Revenue, and select Column Properties.
-
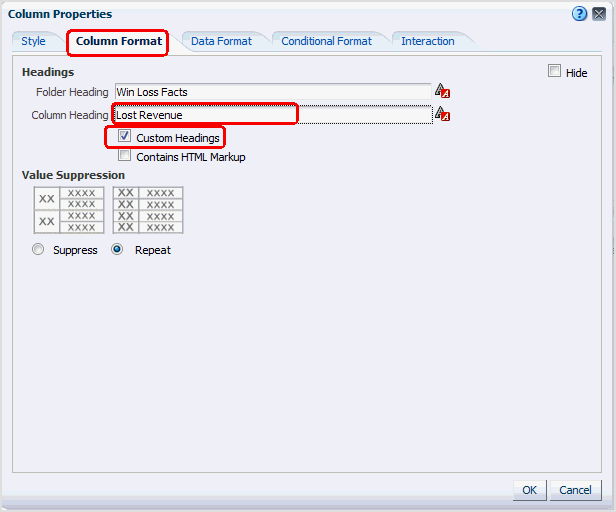
In the Column Properties window, click the Column Format tab, select Custom Headings, then enter Lost Revenue for the Column Heading.
-
-
To enable Lost Revenue to display local currency values, with no decimal places, perform the following steps:
-
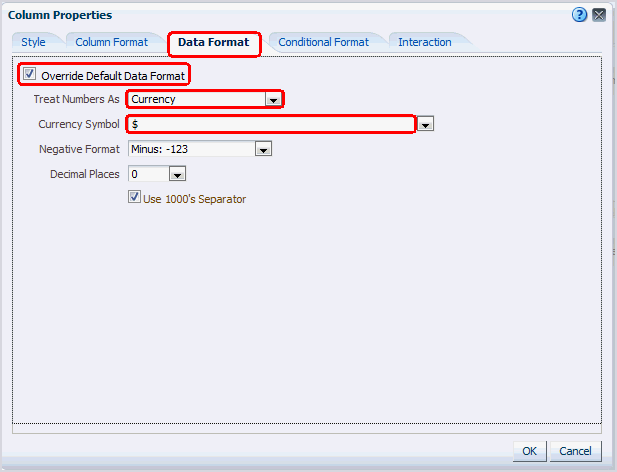
In the Column Properties window, click the Data Format tab.
-
Select Override Default Data Format.
-
For Treat Numbers As, select Currency.
-
For the Currency Symbol, select the currency you require (the following figure shows $).
-
Leave the default value of 0 for Decimal Places.
-
Click OK.
-
-
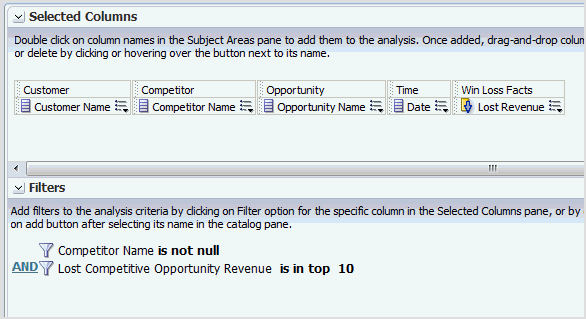
At this point, the Criteria for the analysis displays the two filters:
-
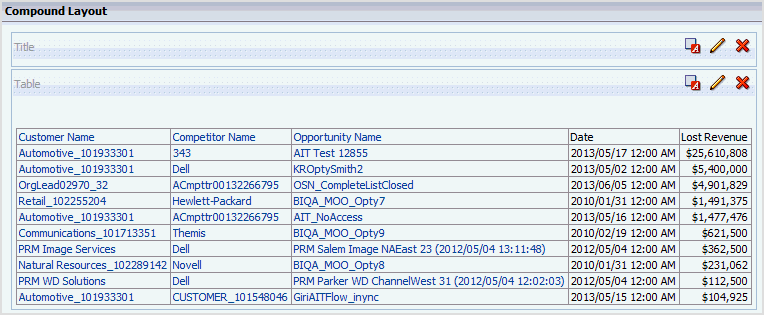
Click the Results tab to show the preview results for this analysis:
-
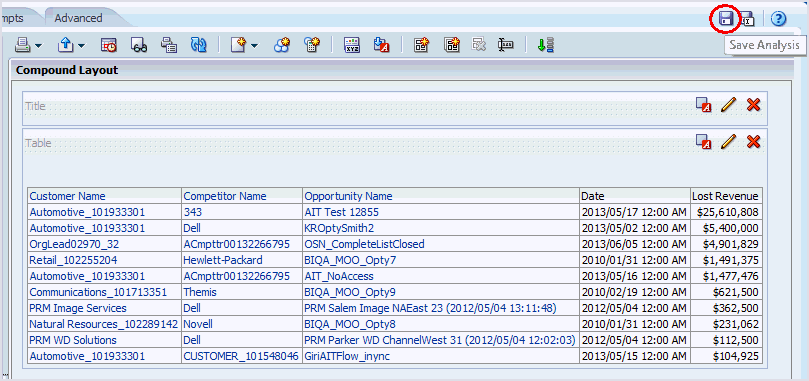
To save the analysis, click the Save Analysis icon near the top-right corner.
-
Save the analysis as follows:
-
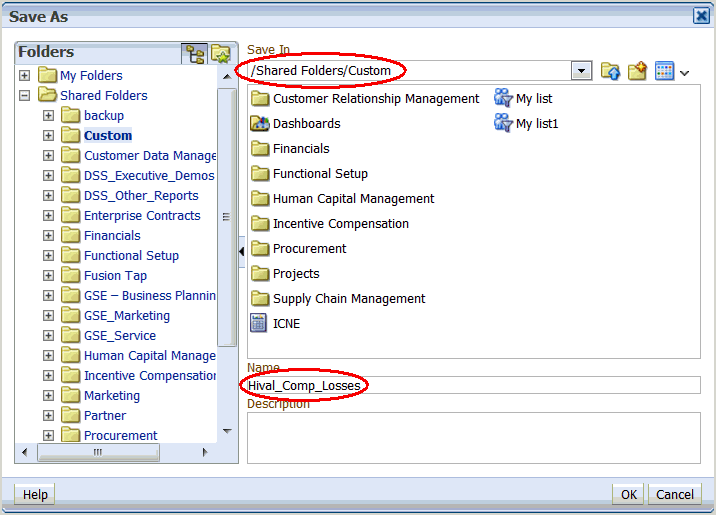
In the Name field, specify a name for the analysis.
-
In the Save In list, select the folder in which you want to save the analysis.
The folder in which you save the analysis controls whether the analysis is available only for your personal use or available to other users.
If you save the analysis in My Folders, then it available only for your personal use. If you save the analysis in Shared Folders/Custom, then it is available to all users who can access Shared Folders/Custom.
The following example shows Shared Folders/Custom as the Save In target directory and Hival_Comp_Losses as the Name for the analysis.
-
Click OK.
-
You can now navigate to the analysis, which looks like this:


