5 Is My Team Closing Revenue in Line with Their Forecast?
This tutorial shows you how to analyze team sales performance by comparing closing revenue with sales forecast figures.
This tutorial is aimed at sales managers and sales vice presidents.
How to Verify that My Team is Closing Revenue in line with Their Forecast
Sales managers and vice presidents can analyze team performance by using the following steps to create a new analysis.
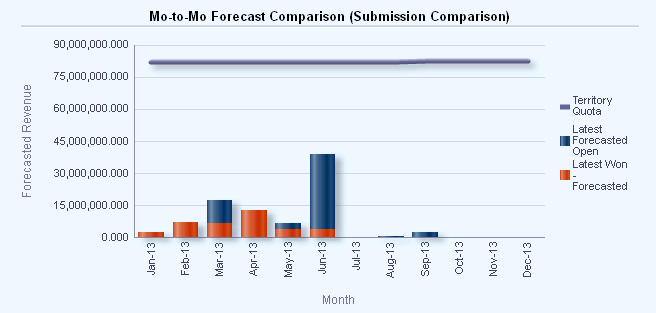
For example, the chart in the following analysis compares month-to-month closing revenue with forecast, against quota.
-
From the Navigator menu, select Reports and Analytics.
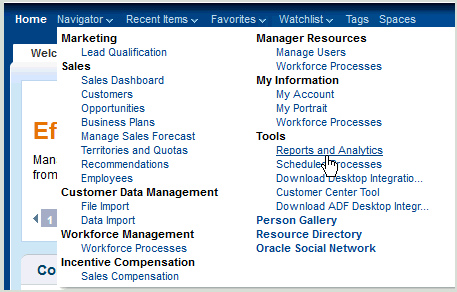
The Reports and Analytics page is displayed.
-
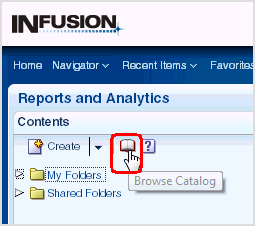
In the Contents pane, click Browse Catalog.
-
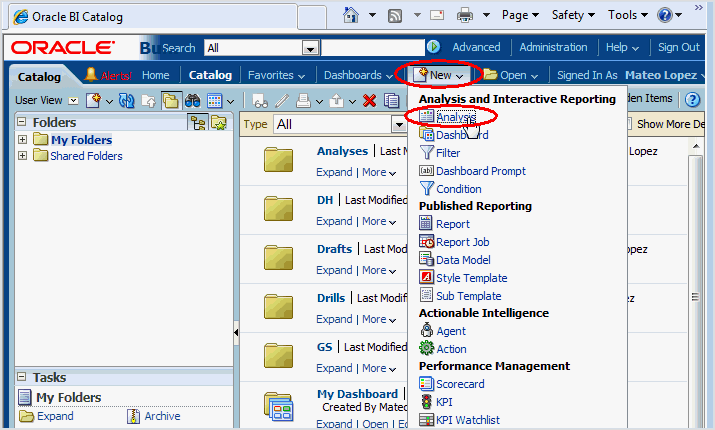
In the Oracle BI Catalog window, click New, then Analysis.
-
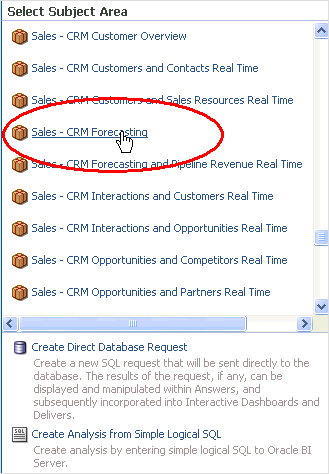
In the list of subject areas, click Sales - CRM Forecasting.
-
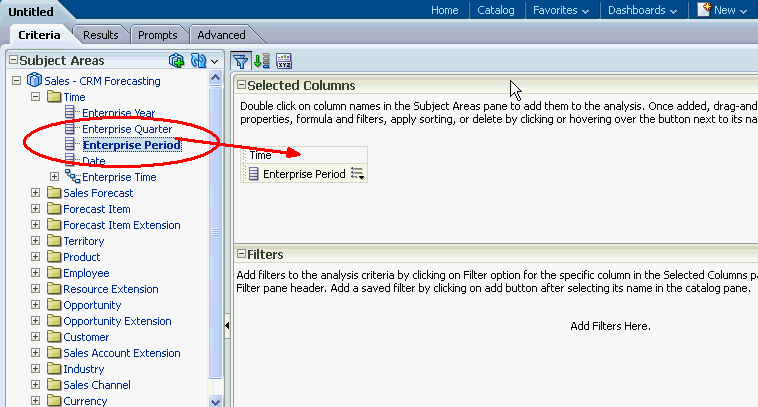
In the Subject Areas tab, expand the Time area, and drag Enterprise Period to the Selected Columns area.
-
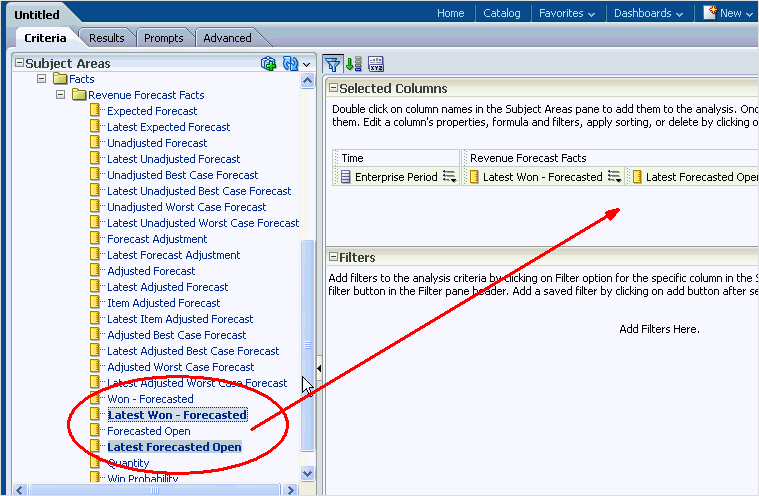
In the Subject Areas tab, expand the Facts\Revenue Forecast Facts area, and drag Latest Forecasted Open and Latest Won - Forecasted to the Selected Columns area.
-
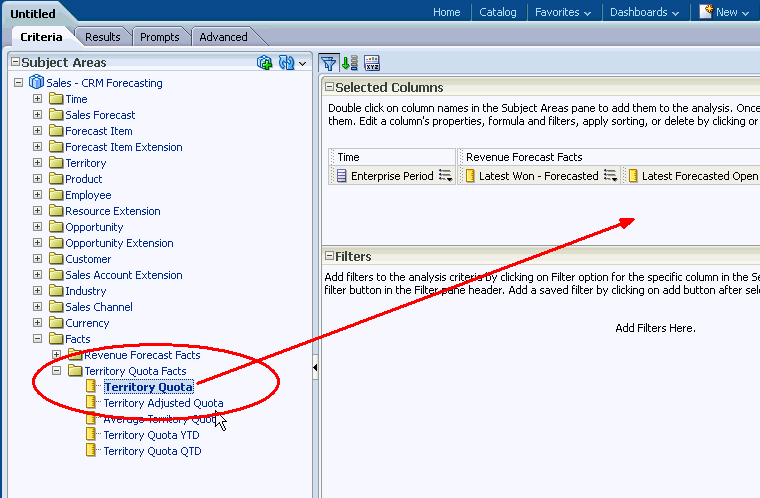
In the Subject Areas tab, expand the Facts\Territory Quota Facts area, and drag Territory Quota to the Selected Columns area.
-
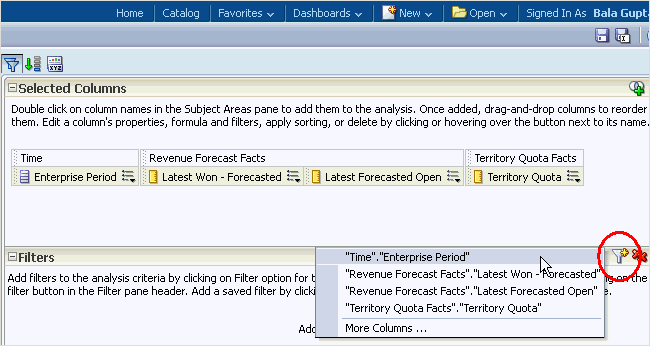
In the Filters area, click the filter icon, and select "Time"."Enterprise Period".
-
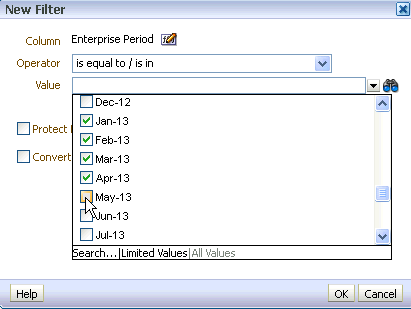
At the New Filter dialog, select is equal to/is in from the Operator list, click the down arrow next to the Value field, select the box next to Jan-13, Feb-13, Mar-13 and so on to Dec-13, then click OK.
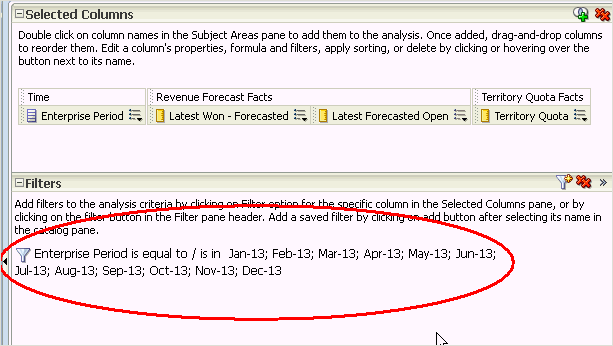
After you click OK, you see Jan-13; Feb-13; Mar-13; and so on displayed in the Filters area.
-
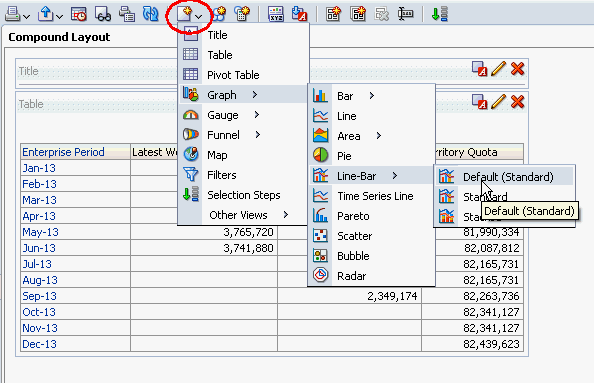
Click Results to display the Results tab, then click New View and select Graph, then Line-Bar, then Default.
-
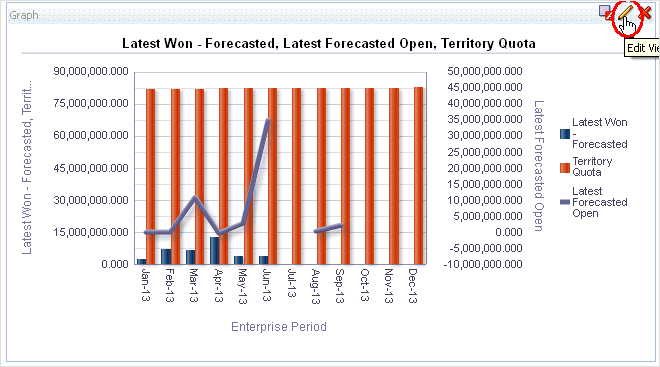
Click Edit View at the top of the Graph area.
-
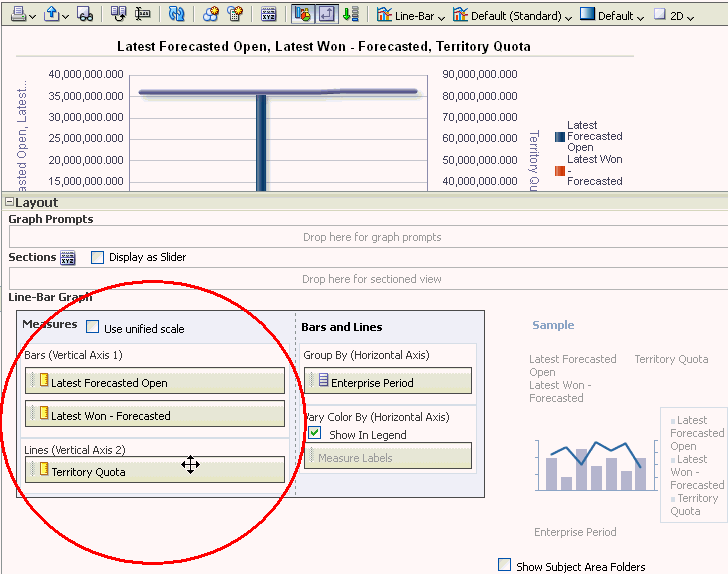
In the Layout area, drag Latest Won - Forecasted from the Lines (Vertical Axis 2) area to the Bars (Vertical Axis 1) area, then drag Territory Quota from the Bars (Vertical Axis 1) area to the Lines (Vertical Axis 2) area.
-
Click Done.
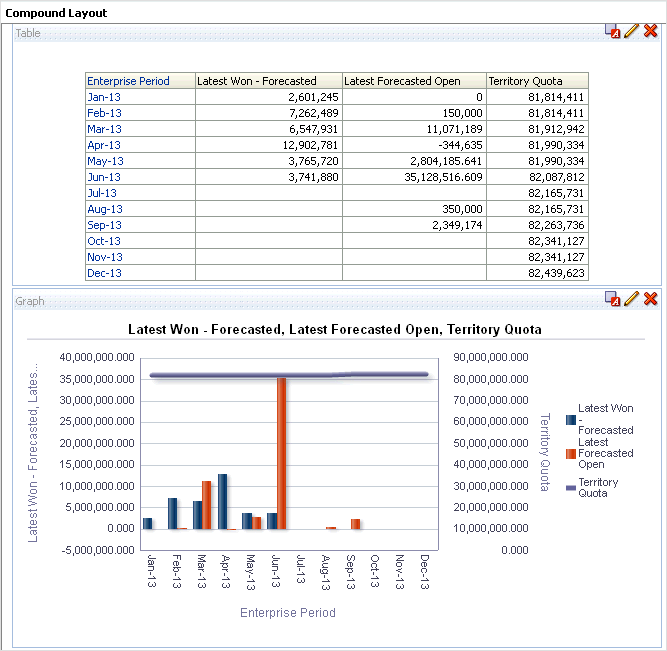
I can now use this report to analyze latest won forecast, latest forecast open, and quota.
-
To save the analysis, click the Save Analysis icon near the top-right corner.

-
Save the analysis as follows:
-
In the Name field, specify a name for the analysis.
-
In the Save In list, select the folder in which you want to save the analysis.
The folder in which you save the analysis controls whether the analysis is available only for your personal use or available to other users.
If you save the analysis in My Folders, then it available only for your personal use. If you save the analysis in Shared Folders/Custom, then it is available to all users who can access Shared Folders/Custom.
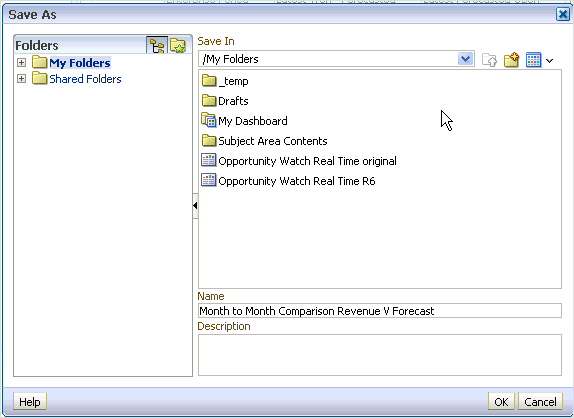
The following example shows My Folders as the Save In target directory and "Month to Month Comparison Revenue V Forecast" as the Name for the analysis.
-
Click OK.
-


